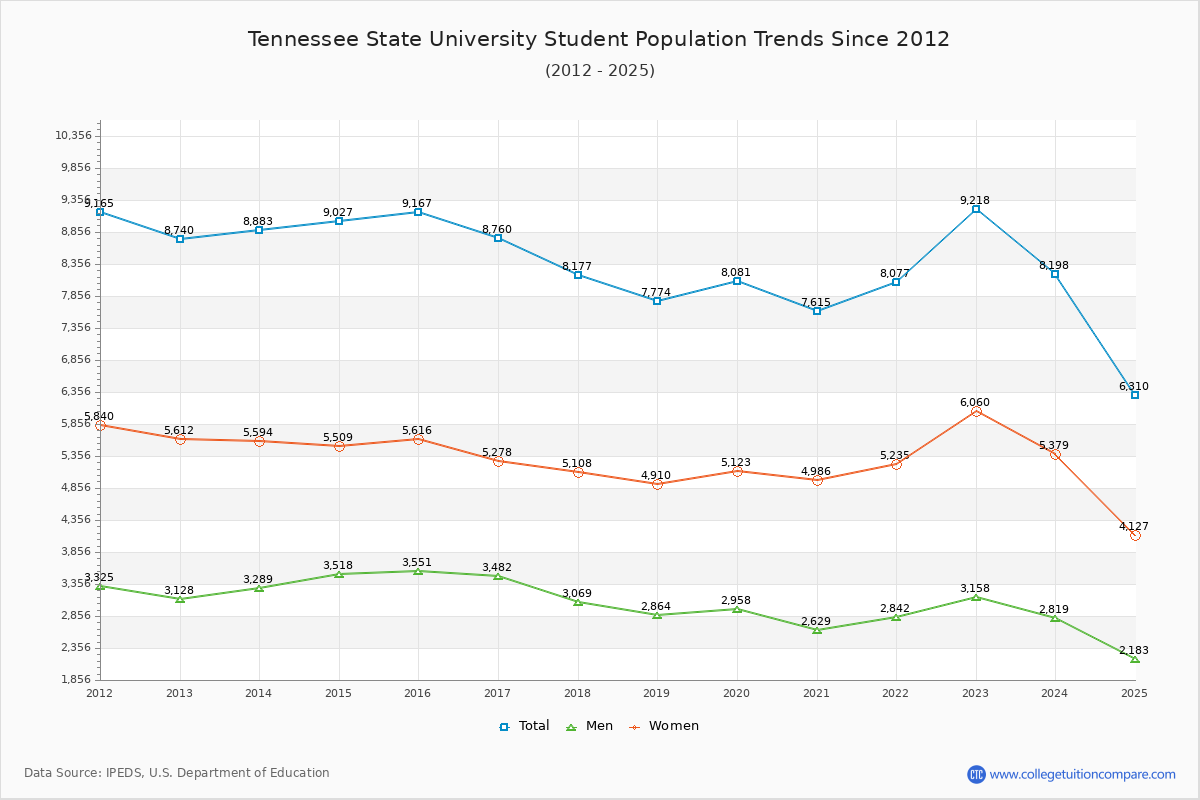
Student Population Changes
The average student population over the last 12 years is 8,502 where 9,218 students are attending the school for the academic year 2022-2023.
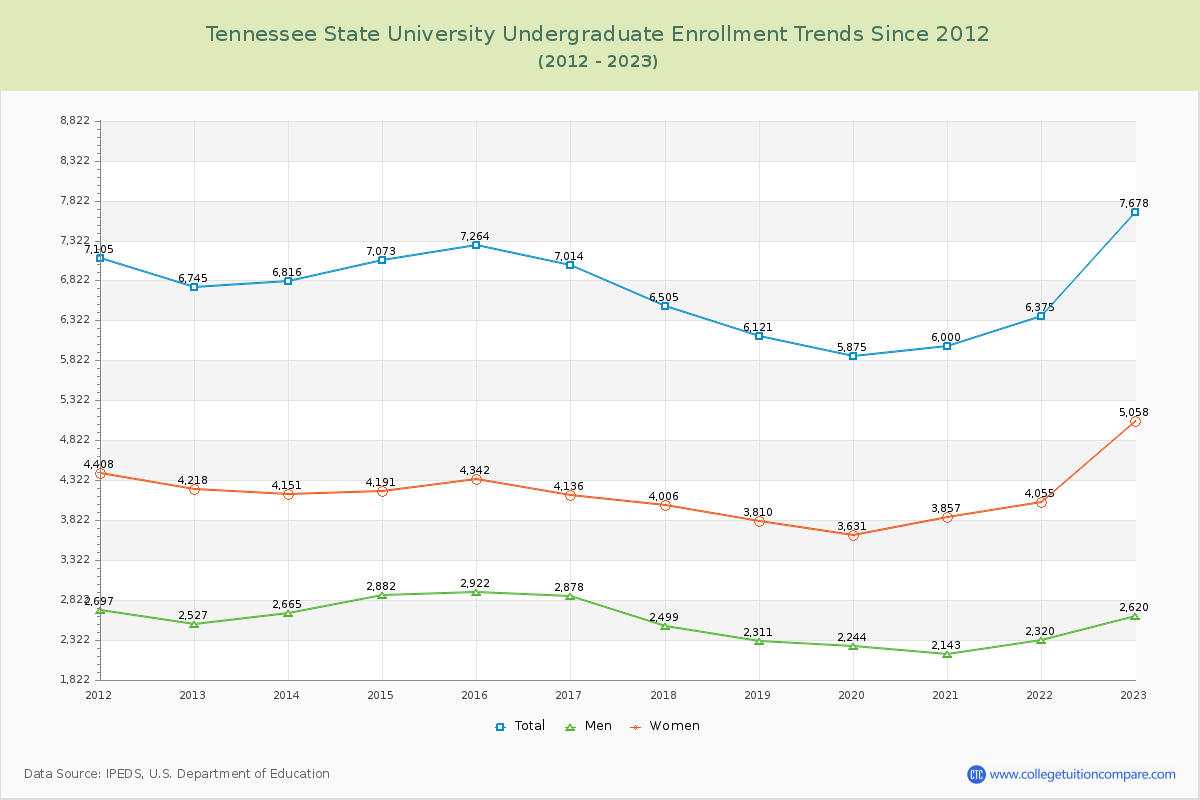
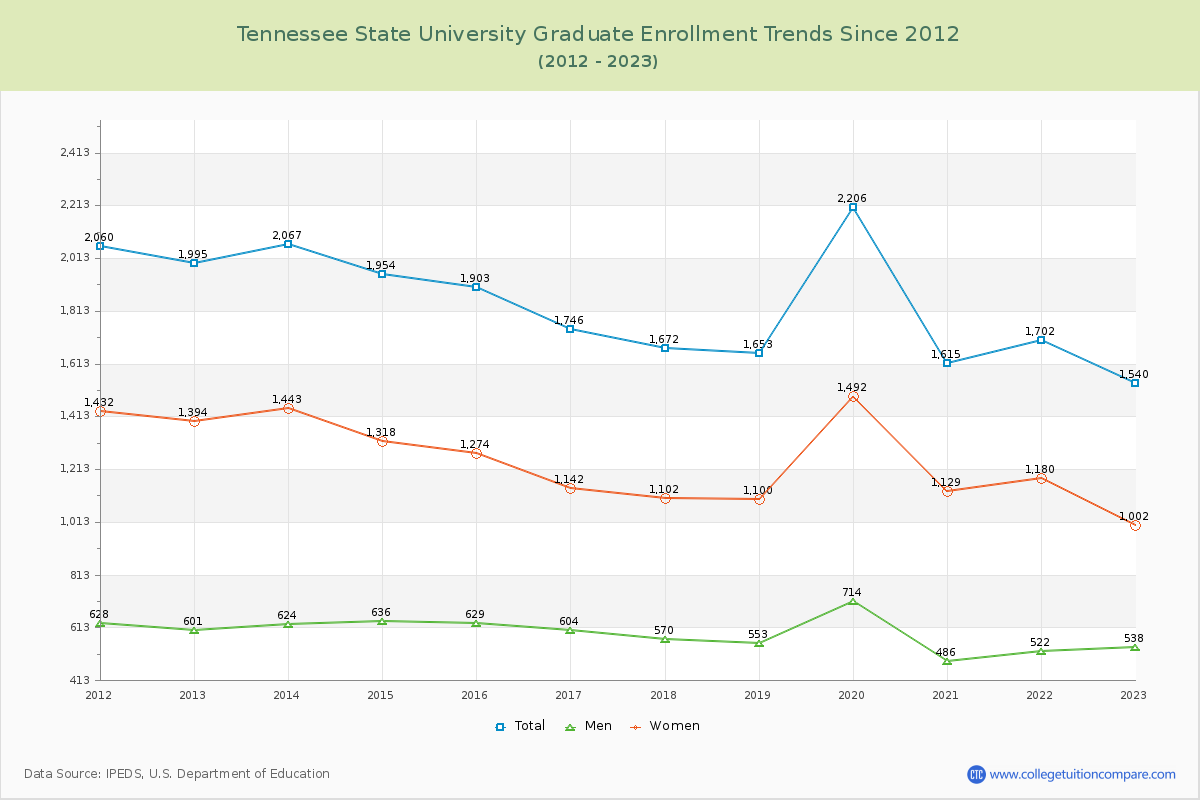
83.29% of total students is undergraduate students and 16.71% students is graduate students. The number of undergraduate students has increased by 933 and the graduate enrollment has decreased by 455 over past 10 years.
The female to male ratio is 1.92 to 1 and it means that there are more female students enrolled in Tennessee State than male students.
The following table and chart illustrate the changes in student population by gender at Tennessee State University since 2012.
| Year | Total | Undergraduate | Graduate | ||||
|---|---|---|---|---|---|---|---|
| Total | Men | Women | Total | Men | Women | ||
| 2012-13 | 8,740 | 6,745 | 2,527 | 4,218 | 1,995 | 601 | 1,394 |
| 2013-14 | 8,883 143 | 6,816 71 | 2,665 138 | 4,151 -67 | 2,067 72 | 624 23 | 1,443 49 |
| 2014-15 | 9,027 144 | 7,073 257 | 2,882 217 | 4,191 40 | 1,954 -113 | 636 12 | 1,318 -125 |
| 2015-16 | 9,167 140 | 7,264 191 | 2,922 40 | 4,342 151 | 1,903 -51 | 629 -7 | 1,274 -44 |
| 2016-17 | 8,760 -407 | 7,014 -250 | 2,878 -44 | 4,136 -206 | 1,746 -157 | 604 -25 | 1,142 -132 |
| 2017-18 | 8,177 -583 | 6,505 -509 | 2,499 -379 | 4,006 -130 | 1,672 -74 | 570 -34 | 1,102 -40 |
| 2018-19 | 7,774 -403 | 6,121 -384 | 2,311 -188 | 3,810 -196 | 1,653 -19 | 553 -17 | 1,100 -2 |
| 2019-20 | 8,081 307 | 5,875 -246 | 2,244 -67 | 3,631 -179 | 2,206 553 | 714 161 | 1,492 392 |
| 2020-21 | 7,615 -466 | 6,000 125 | 2,143 -101 | 3,857 226 | 1,615 -591 | 486 -228 | 1,129 -363 |
| 2021-22 | 8,077 462 | 6,375 375 | 2,320 177 | 4,055 198 | 1,702 87 | 522 36 | 1,180 51 |
| 2022-23 | 9,218 1,141 | 7,678 1,303 | 2,620 300 | 5,058 1,003 | 1,540 -162 | 538 16 | 1,002 -178 |
| Average | 8,502 | 6,679 | 2,546 | 4,132 | 1,823 | 589 | 1,234 |