Enrollment Trends at Tennessee College of Applied Technology-Oneida-Huntsville

124

Total Enrollment

114

Men

10

Women

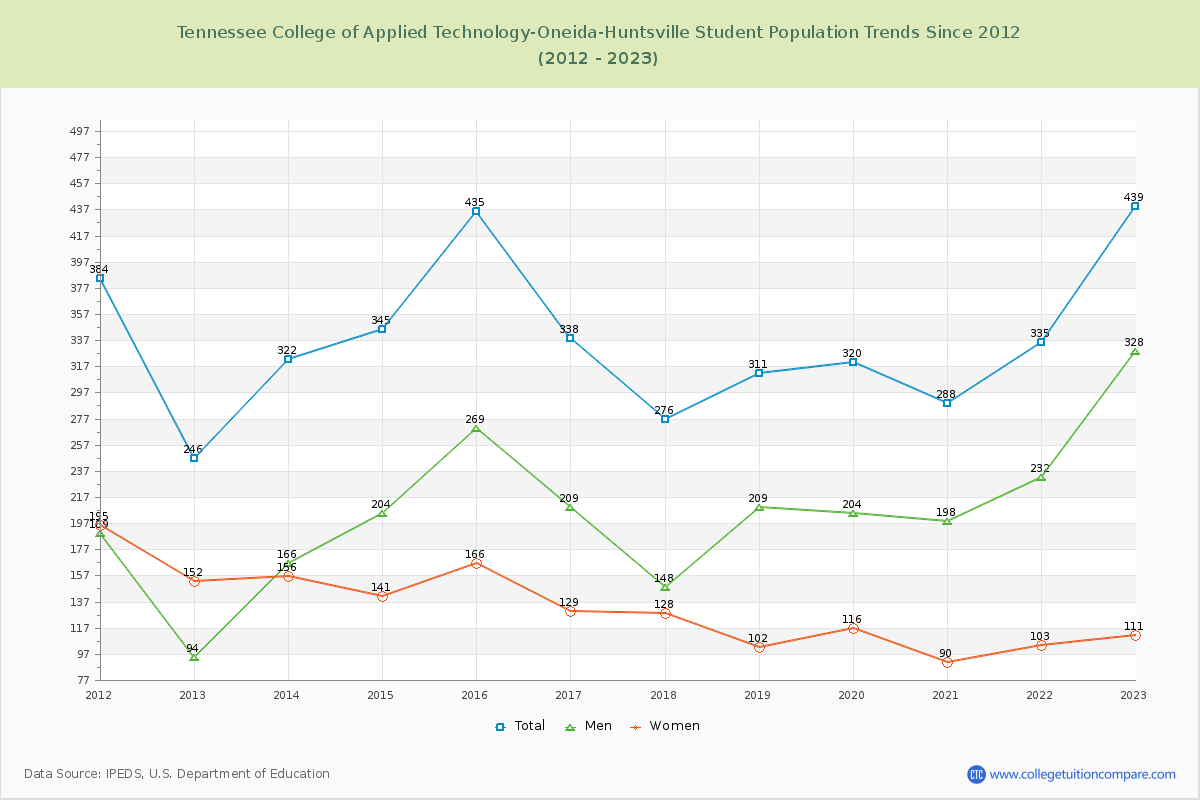
The student population at Tennessee College of Applied Technology-Oneida-Huntsville is 559 (all undergraduate). The number of students has increased by 124 over the past decade.

The female to male ratio is 0.46 to 1 which means that majority of population is on male students.

All students have enrolled in on-campus classes (Tennessee College of Applied Technology-Oneida-Huntsville does not offer online degree/certificate program).

Student Population Changes

The average student population over the last 11 years is 376 where 559 students are attending the school for the academic year 2024-2025.

The female to male ratio is 0.46 to 1 and it means that there are far more male students enrolled in Tennessee College of Applied Technology-Oneida-Huntsville than female students.

The following table and chart illustrate the changes in student population by gender at Tennessee College of Applied Technology-Oneida-Huntsville since 2015.

YearTotalMenWomen
2015-16435269166
2016-17338
-97
209
-60
129
-37
2017-18276
-62
148
-61
128
-1
2018-19311
35
209
61
102
-26
2019-20320
9
204
-5
116
14
2020-21288
-32
198
-6
90
-26
2021-22335
47
232
34
103
13
2022-23439
104
328
96
111
8
2023-24462
23
346
18
116
5
2024-25559
97
383
37
176
60
Average376253124
Tennessee College of Applied Technology-Oneida-Huntsville Enrollment Trends Chart

Enrollment by Race/Ethnicity Changes

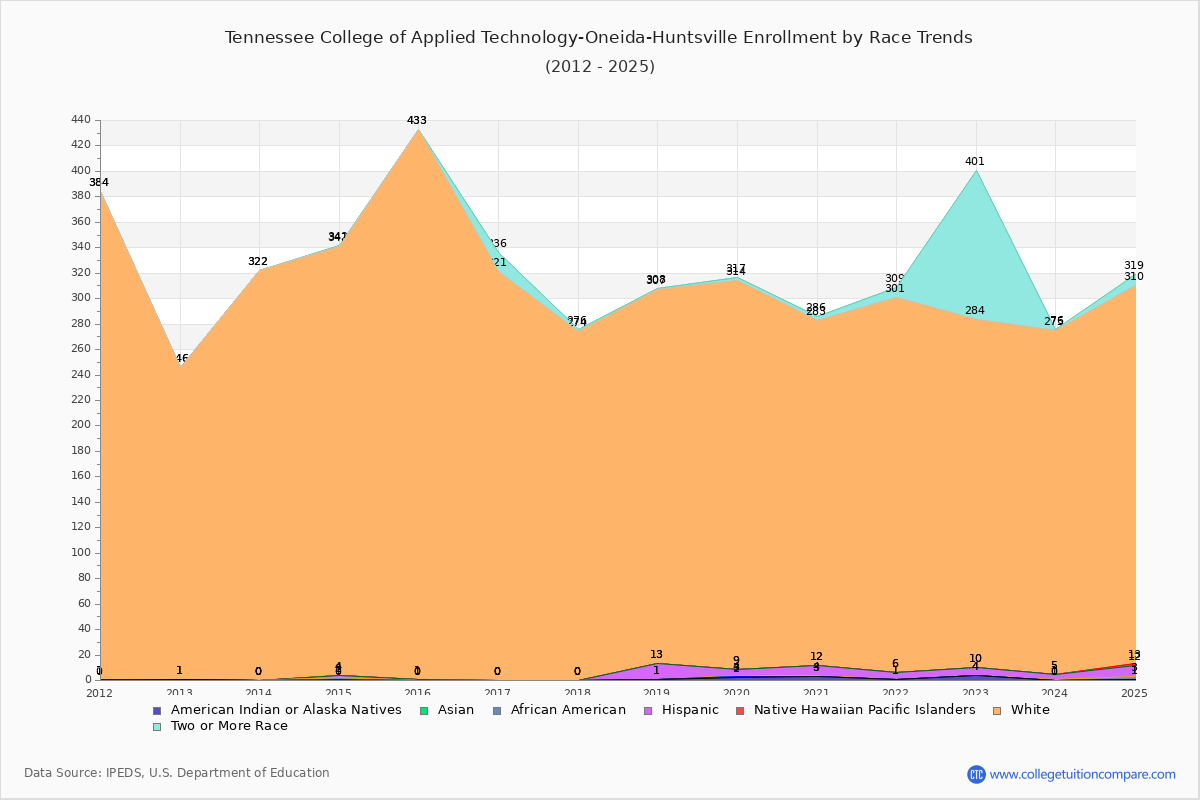
The percentage of white students is 53.13%. The percentage was 99.31% 10 years ago and Tennessee College of Applied Technology-Oneida-Huntsville still has a high percentage of white students. Hispanic students comprise 1.61% of the student body.

Over the past 10 years, the racial composition has shifted. The percentage of white students decreased from 99.31% to 53.13%. Black student enrollment increased from 0.00% to 0.36%. Hispanic student representation expanded from 0.23% to 1.61%.

The overall racial diversity, measured by the Census Bureau Diversity Index, is 0.7172 which indicates that quite diverse. This increased from 0.0137 a decade ago, suggesting that racial diversity has improved.

The following table and chart illustrate the student population trends by race/ethnicity at Tennessee College of Applied Technology-Oneida-Huntsville over the past 11 years (2015-2025).

YearAmerican Indian or Native AmericanAsianBlackHispanicNative Hawaiian or Other Pacific IslanderWhiteTwo or More Races
2015-16000104320
2016-170000032115
2017-18000002742
2018-191001202941
2019-20211503053
2020-21301802713
2021-22100502958
2022-2340060274117
2023-24001402701
2024-25102912979
Average1015030316
Tennessee College of Applied Technology-Oneida-Huntsville Enrollment by Race Trends Chart

Distance Learning (Online Courses) Enrollment Changes

Tennessee College of Applied Technology-Oneida-Huntsville does not offer online degree/certificate programs. All Students have enrolled in on-campus programs.


Ratings & Review

Share your experiences and thoughts about Tennessee College of Applied Technology-Oneida-Huntsville. It will be a great help to applicants and prospective students!