Enrollment Trends at TCAT Memphis

1,066

Total Enrollment

876

Men

190

Women

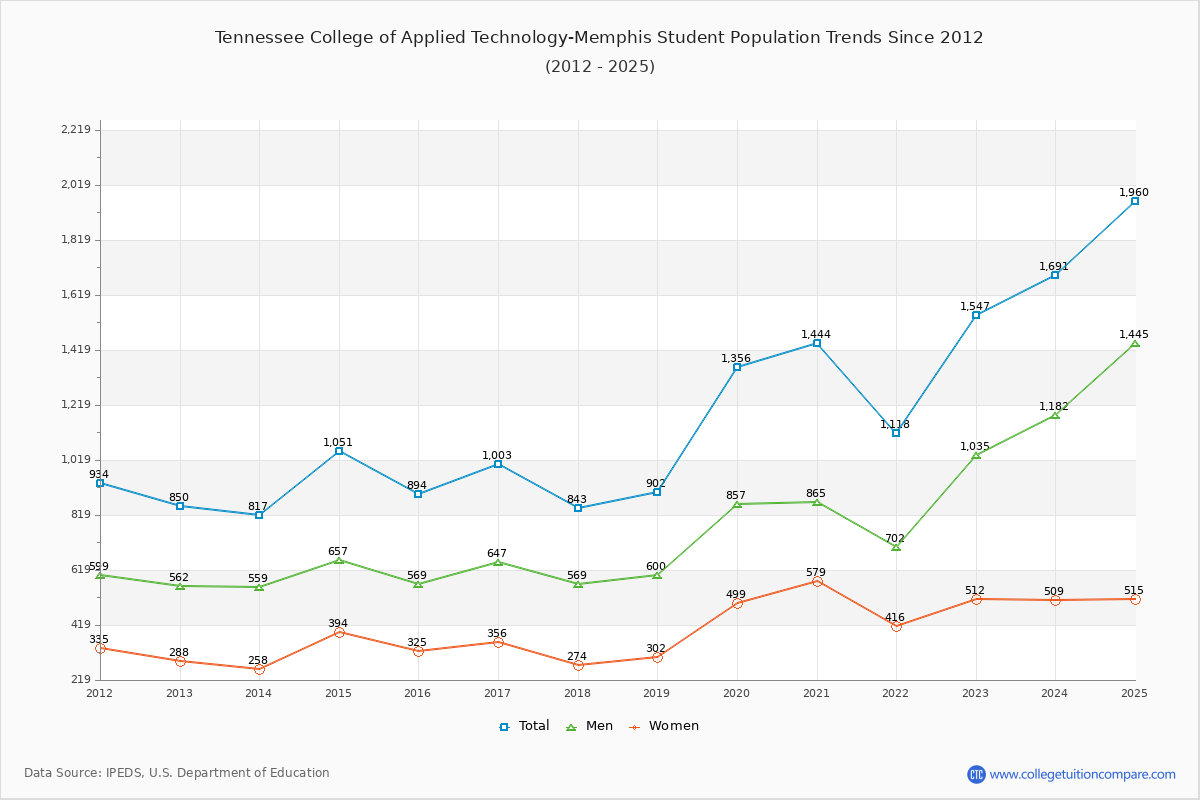
The student population at Tennessee College of Applied Technology-Memphis is 1,960 (all undergraduate). The number of students has increased by 1,066 over the past decade.

The female to male ratio is 0.36 to 1 which means that majority of population is on male students.

All students have enrolled in on-campus classes (Tennessee College of Applied Technology-Memphis does not offer online degree/certificate program).

Student Population Changes

The average student population over the last 11 years is 1,276 where 1,960 students are attending the school for the academic year 2024-2025.

The female to male ratio is 0.36 to 1 and it means that there are far more male students enrolled in TCAT Memphis than female students.

The following table and chart illustrate the changes in student population by gender at Tennessee College of Applied Technology-Memphis since 2015.

YearTotalMenWomen
2015-16894569325
2016-171,003
109
647
78
356
31
2017-18843
-160
569
-78
274
-82
2018-19902
59
600
31
302
28
2019-201,356
454
857
257
499
197
2020-211,444
88
865
8
579
80
2021-221,118
-326
702
-163
416
-163
2022-231,547
429
1,035
333
512
96
2023-241,691
144
1,182
147
509
-3
2024-251,960
269
1,445
263
515
6
Average1,276847429
Tennessee College of Applied Technology-Memphis Enrollment Trends Chart

Enrollment by Race/Ethnicity Changes

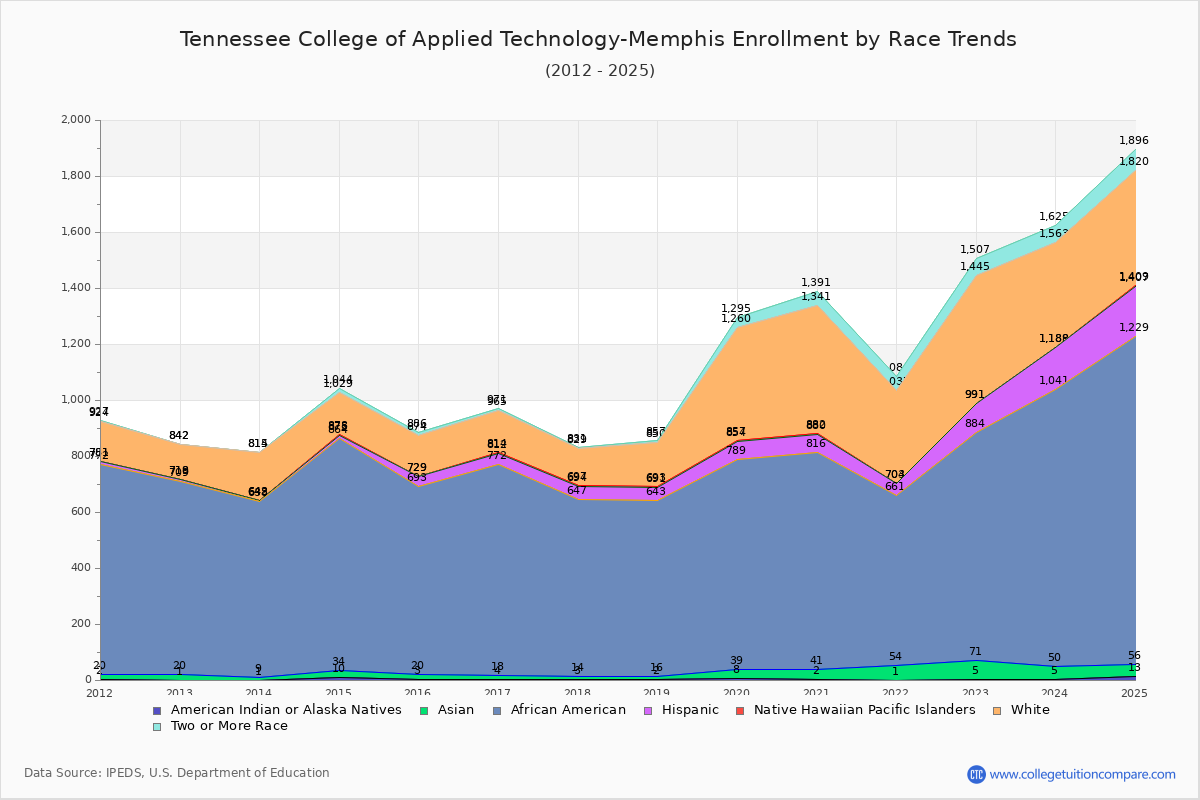
The percentage of white students is 20.97% and the percentage of black students is 59.85% at Tennessee College of Applied Technology-Memphis. 2.19% of enrolled students is Asian. Hispanic students comprise 9.08% of the student body.

Over the past 10 years, the racial composition has shifted. The percentage of white students increased from 16.22% to 20.97%. Asian enrollment grew from 1.90% to 2.19%. Black student enrollment decreased from 75.28% to 59.85%. Hispanic student representation expanded from 4.03% to 9.08%.

The overall racial diversity, measured by the Census Bureau Diversity Index, is 0.5876 which indicates that moderately diverse. This increased from 0.4048 a decade ago, suggesting that racial diversity has improved.

The following table and chart illustrate the student population trends by race/ethnicity at Tennessee College of Applied Technology-Memphis over the past 11 years (2015-2025).

YearAmerican Indian or Native AmericanAsianBlackHispanicNative Hawaiian or Other Pacific IslanderWhiteTwo or More Races
2015-1631767336014512
2016-174147544021516
2017-183116334731322
2018-192146274821577
2019-2083175065340335
2020-2123977564245950
2021-2215360742133347
2022-23566813107045462
2023-24545991147137462
2024-2513431,173178241176
Average53378077230236
Tennessee College of Applied Technology-Memphis Enrollment by Race Trends Chart

Distance Learning (Online Courses) Enrollment Changes

Tennessee College of Applied Technology-Memphis does not offer online degree/certificate programs. All Students have enrolled in on-campus programs.


Ratings & Review

Share your experiences and thoughts about Tennessee College of Applied Technology-Memphis. It will be a great help to applicants and prospective students!