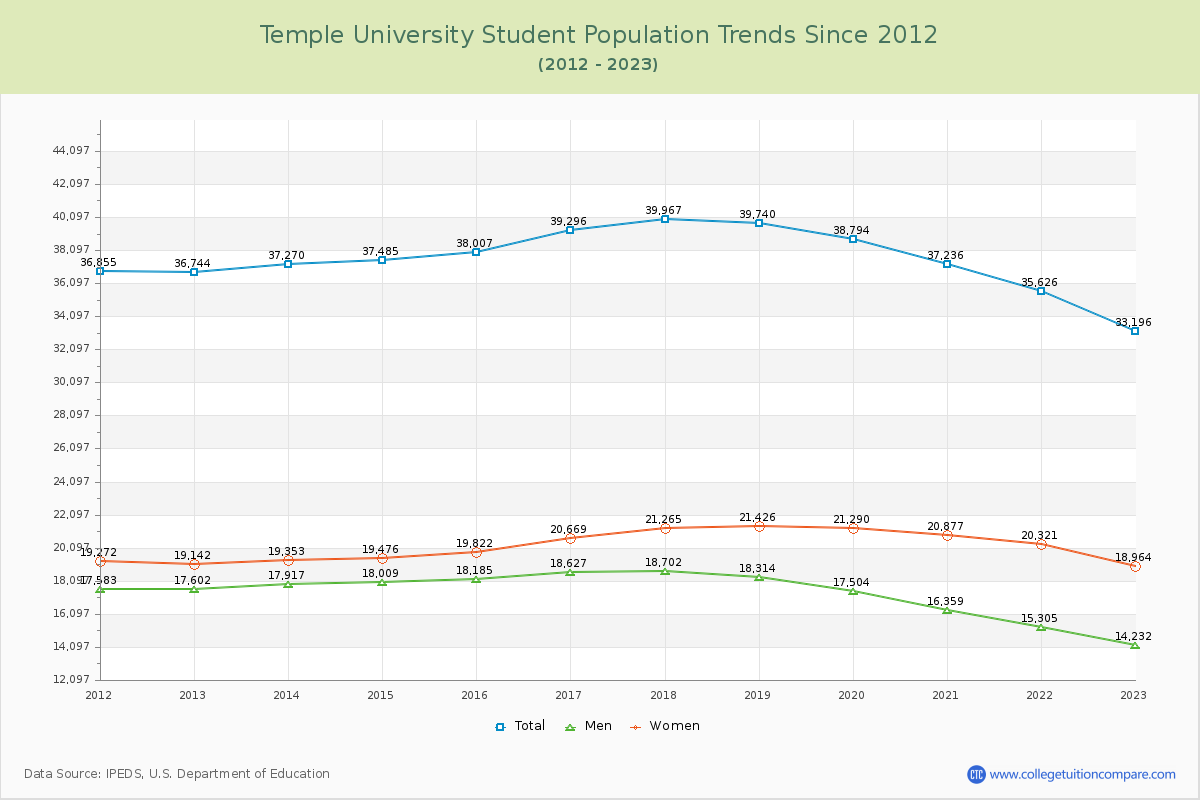
Student Population Changes
The average student population over the last 12 years is 37,578 where 33,196 students are attending the school for the academic year 2022-2023.
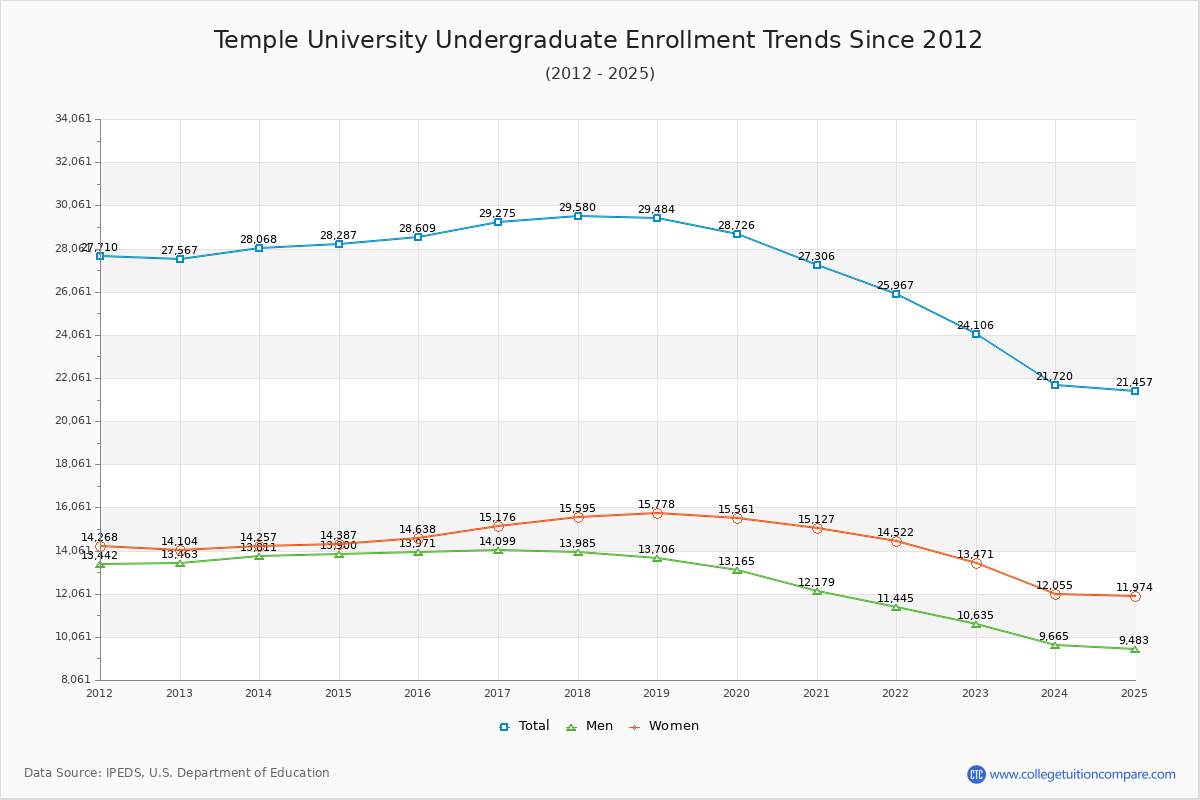
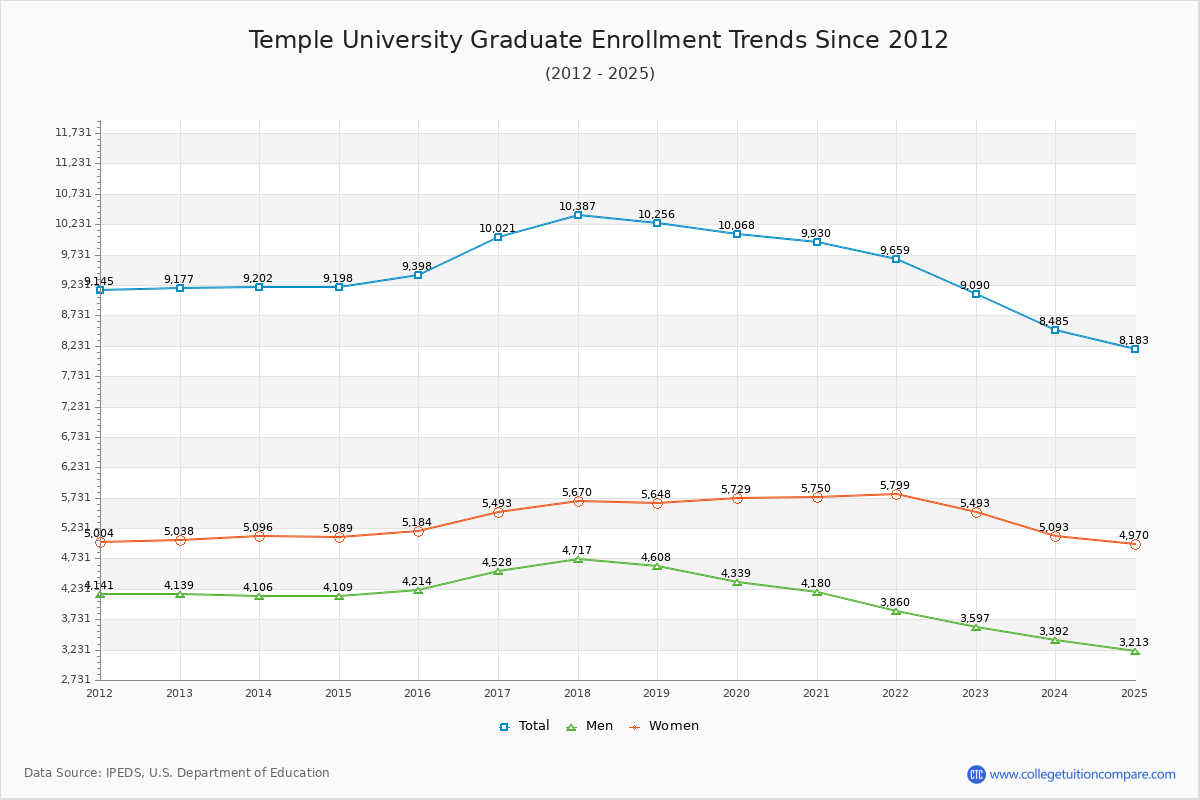
72.62% of total students is undergraduate students and 27.38% students is graduate students. The number of undergraduate students has decreased by 3,461 and the graduate enrollment has decreased by 87 over past 10 years.
The female to male ratio is 1.33 to 1 and it means that there are more female students enrolled in Temple than male students.
The following table and chart illustrate the changes in student population by gender at Temple University since 2012.
| Year | Total | Undergraduate | Graduate | ||||
|---|---|---|---|---|---|---|---|
| Total | Men | Women | Total | Men | Women | ||
| 2012-13 | 36,744 | 27,567 | 13,463 | 14,104 | 9,177 | 4,139 | 5,038 |
| 2013-14 | 37,270 526 | 28,068 501 | 13,811 348 | 14,257 153 | 9,202 25 | 4,106 -33 | 5,096 58 |
| 2014-15 | 37,485 215 | 28,287 219 | 13,900 89 | 14,387 130 | 9,198 -4 | 4,109 3 | 5,089 -7 |
| 2015-16 | 38,007 522 | 28,609 322 | 13,971 71 | 14,638 251 | 9,398 200 | 4,214 105 | 5,184 95 |
| 2016-17 | 39,296 1,289 | 29,275 666 | 14,099 128 | 15,176 538 | 10,021 623 | 4,528 314 | 5,493 309 |
| 2017-18 | 39,967 671 | 29,580 305 | 13,985 -114 | 15,595 419 | 10,387 366 | 4,717 189 | 5,670 177 |
| 2018-19 | 39,740 -227 | 29,484 -96 | 13,706 -279 | 15,778 183 | 10,256 -131 | 4,608 -109 | 5,648 -22 |
| 2019-20 | 38,794 -946 | 28,726 -758 | 13,165 -541 | 15,561 -217 | 10,068 -188 | 4,339 -269 | 5,729 81 |
| 2020-21 | 37,236 -1,558 | 27,306 -1,420 | 12,179 -986 | 15,127 -434 | 9,930 -138 | 4,180 -159 | 5,750 21 |
| 2021-22 | 35,626 -1,610 | 25,967 -1,339 | 11,445 -734 | 14,522 -605 | 9,659 -271 | 3,860 -320 | 5,799 49 |
| 2022-23 | 33,196 -2,430 | 24,106 -1,861 | 10,635 -810 | 13,471 -1,051 | 9,090 -569 | 3,597 -263 | 5,493 -306 |
| Average | 37,578 | 27,907 | 13,124 | 14,783 | 9,671 | 4,218 | 5,454 |