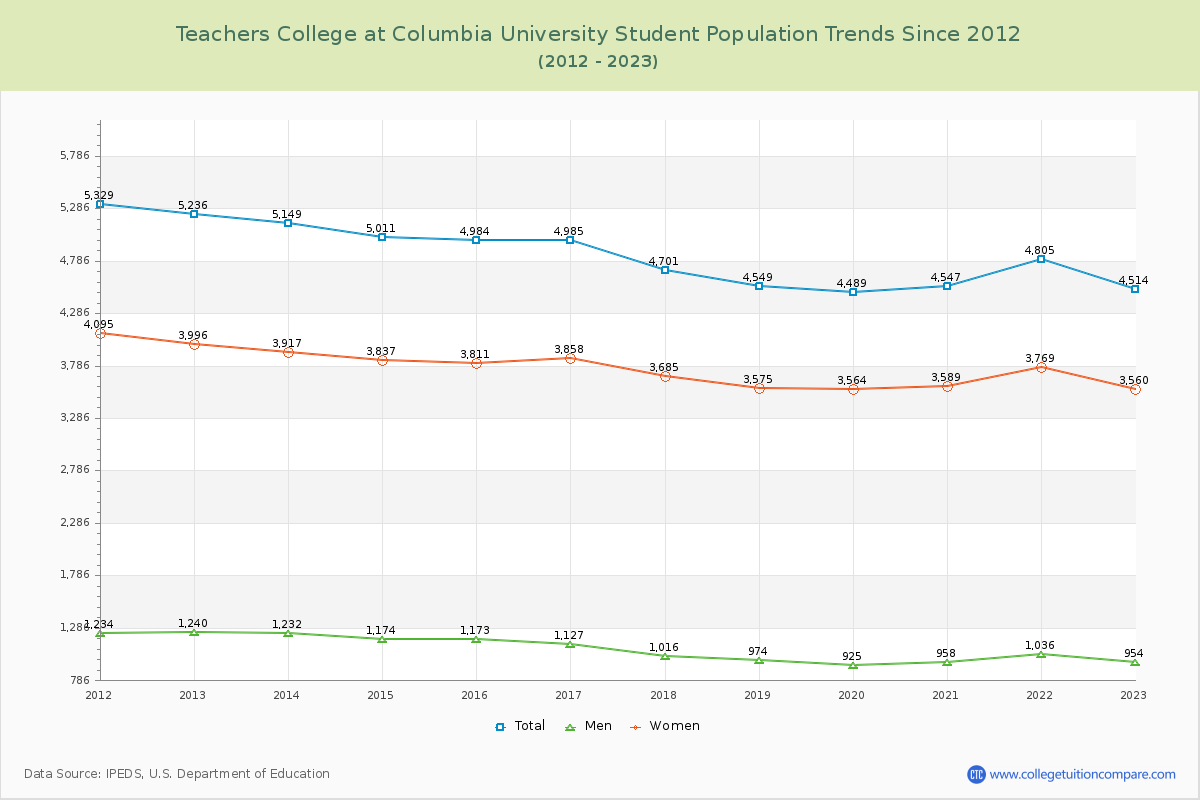
Student Population Changes
The average student population over the last 12 years is 4,815 where 4,514 students are attending the school for the academic year 2022-2023.
The female to male ratio is 3.73 to 1 and it means that there are far more female students enrolled in Teachers College than male students.
The following table and chart illustrate the changes in student population by gender at Teachers College at Columbia University since 2012.
| Year | Total | Men | Women |
|---|---|---|---|
| 2012-13 | 5,236 | 1,240 | 3,996 |
| 2013-14 | 5,149 -87 | 1,232 -8 | 3,917 -79 |
| 2014-15 | 5,011 -138 | 1,174 -58 | 3,837 -80 |
| 2015-16 | 4,984 -27 | 1,173 -1 | 3,811 -26 |
| 2016-17 | 4,985 1 | 1,127 -46 | 3,858 47 |
| 2017-18 | 4,701 -284 | 1,016 -111 | 3,685 -173 |
| 2018-19 | 4,549 -152 | 974 -42 | 3,575 -110 |
| 2019-20 | 4,489 -60 | 925 -49 | 3,564 -11 |
| 2020-21 | 4,547 58 | 958 33 | 3,589 25 |
| 2021-22 | 4,805 258 | 1,036 78 | 3,769 180 |
| 2022-23 | 4,514 -291 | 954 -82 | 3,560 -209 |
| Average | 4,815 | 1,074 | 3,742 |