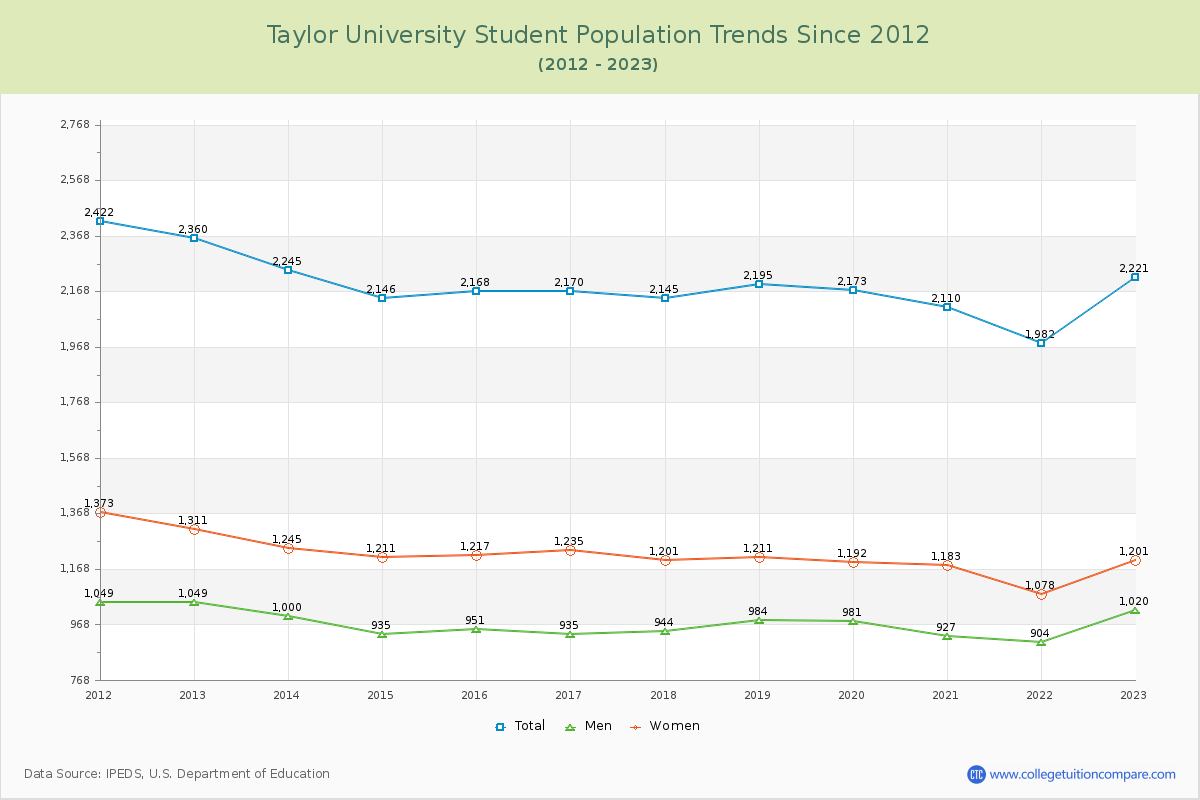
Student Population Changes
The average student population over the last 12 years is 2,174 where 2,221 students are attending the school for the academic year 2022-2023.
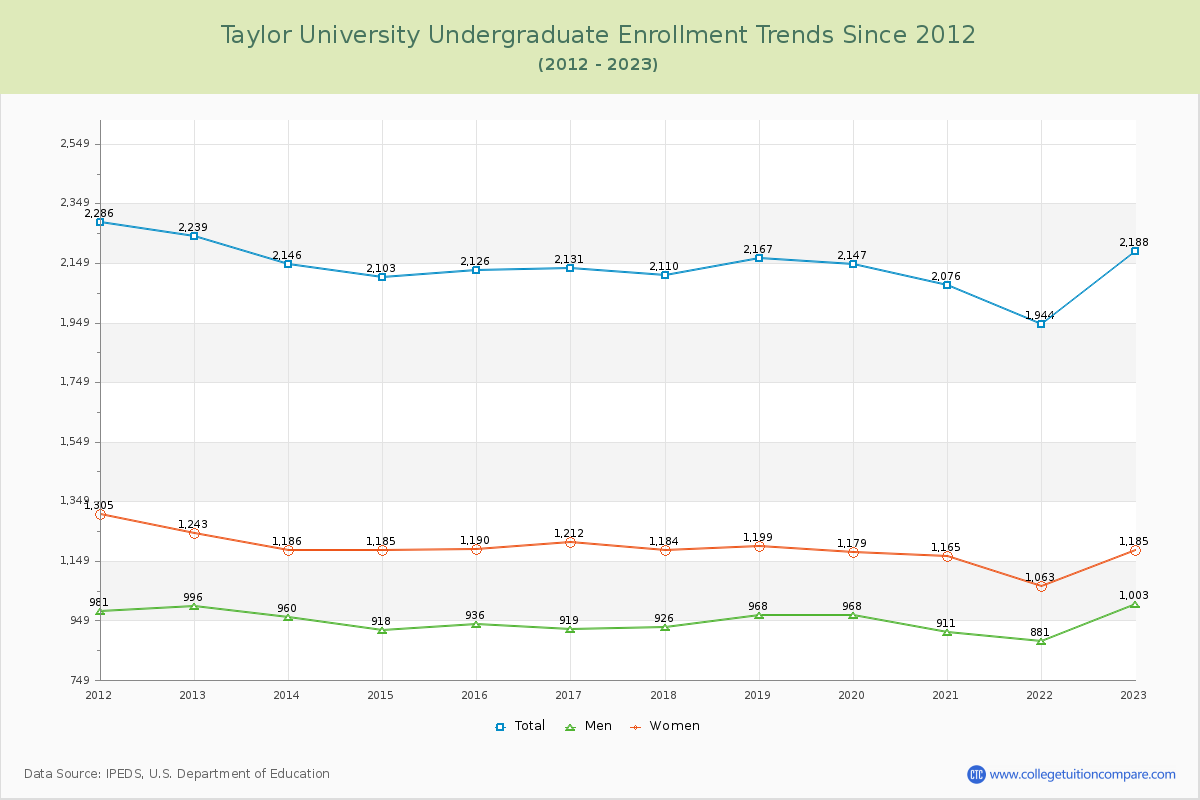
98.51% of total students is undergraduate students and 1.49% students is graduate students. The number of undergraduate students has decreased by 51 and the graduate enrollment has decreased by 88 over past 10 years.
The female to male ratio is 1.18 to 1 and it means that there are slightly more female students enrolled in Taylor than male students.
The following table and chart illustrate the changes in student population by gender at Taylor University since 2012.
| Year | Total | Undergraduate | Graduate | ||||
|---|---|---|---|---|---|---|---|
| Total | Men | Women | Total | Men | Women | ||
| 2012-13 | 2,360 | 2,239 | 996 | 1,243 | 121 | 53 | 68 |
| 2013-14 | 2,245 -115 | 2,146 -93 | 960 -36 | 1,186 -57 | 99 -22 | 40 -13 | 59 -9 |
| 2014-15 | 2,146 -99 | 2,103 -43 | 918 -42 | 1,185 -1 | 43 -56 | 17 -23 | 26 -33 |
| 2015-16 | 2,168 22 | 2,126 23 | 936 18 | 1,190 5 | 42 -1 | 15 -2 | 27 1 |
| 2016-17 | 2,170 2 | 2,131 5 | 919 -17 | 1,212 22 | 39 -3 | 16 1 | 23 -4 |
| 2017-18 | 2,145 -25 | 2,110 -21 | 926 7 | 1,184 -28 | 35 -4 | 18 2 | 17 -6 |
| 2018-19 | 2,195 50 | 2,167 57 | 968 42 | 1,199 15 | 28 -7 | 16 -2 | 12 -5 |
| 2019-20 | 2,173 -22 | 2,147 -20 | 968 0 | 1,179 -20 | 26 -2 | 13 -3 | 13 1 |
| 2020-21 | 2,110 -63 | 2,076 -71 | 911 -57 | 1,165 -14 | 34 8 | 16 3 | 18 5 |
| 2021-22 | 1,982 -128 | 1,944 -132 | 881 -30 | 1,063 -102 | 38 4 | 23 7 | 15 -3 |
| 2022-23 | 2,221 239 | 2,188 244 | 1,003 122 | 1,185 122 | 33 -5 | 17 -6 | 16 1 |
| Average | 2,174 | 2,125 | 944 | 1,181 | 49 | 22 | 27 |