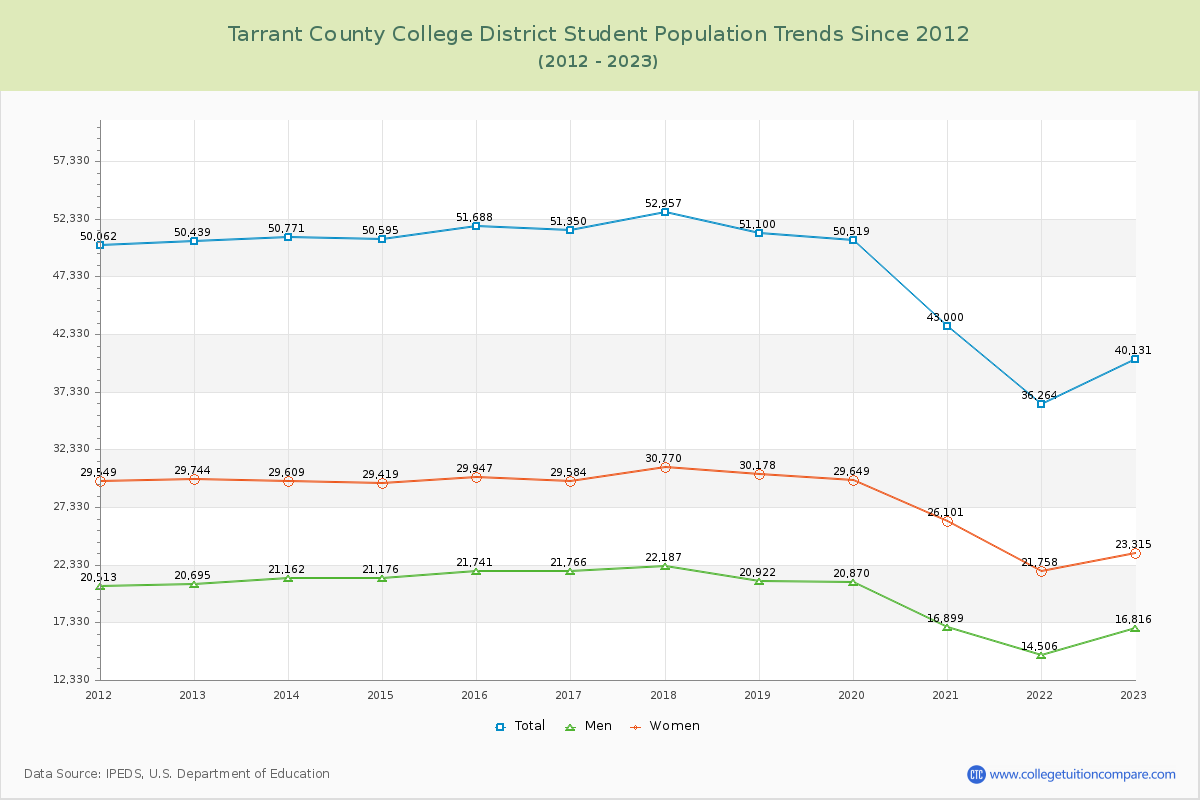
Student Population Changes
The average student population over the last 12 years is 48,074 where 40,131 students are attending the school for the academic year 2022-2023.
The female to male ratio is 1.39 to 1 and it means that there are more female students enrolled in Tarrant County College District than male students.
The following table and chart illustrate the changes in student population by gender at Tarrant County College District since 2012.
| Year | Total | Men | Women |
|---|---|---|---|
| 2012-13 | 50,439 | 20,695 | 29,744 |
| 2013-14 | 50,771 332 | 21,162 467 | 29,609 -135 |
| 2014-15 | 50,595 -176 | 21,176 14 | 29,419 -190 |
| 2015-16 | 51,688 1,093 | 21,741 565 | 29,947 528 |
| 2016-17 | 51,350 -338 | 21,766 25 | 29,584 -363 |
| 2017-18 | 52,957 1,607 | 22,187 421 | 30,770 1,186 |
| 2018-19 | 51,100 -1,857 | 20,922 -1,265 | 30,178 -592 |
| 2019-20 | 50,519 -581 | 20,870 -52 | 29,649 -529 |
| 2020-21 | 43,000 -7,519 | 16,899 -3,971 | 26,101 -3,548 |
| 2021-22 | 36,264 -6,736 | 14,506 -2,393 | 21,758 -4,343 |
| 2022-23 | 40,131 3,867 | 16,816 2,310 | 23,315 1,557 |
| Average | 48,074 | 19,885 | 28,189 |