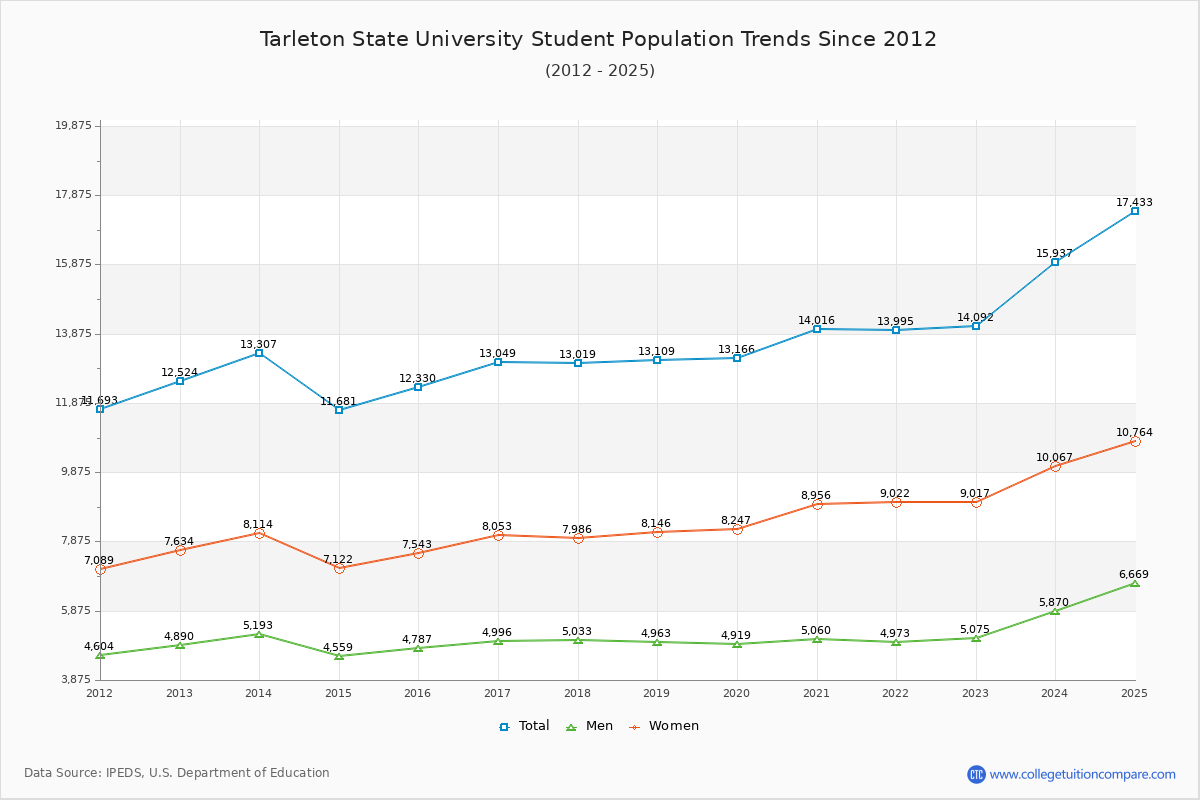
Student Population Changes
The average student population over the last 12 years is 13,117 where 14,092 students are attending the school for the academic year 2022-2023.
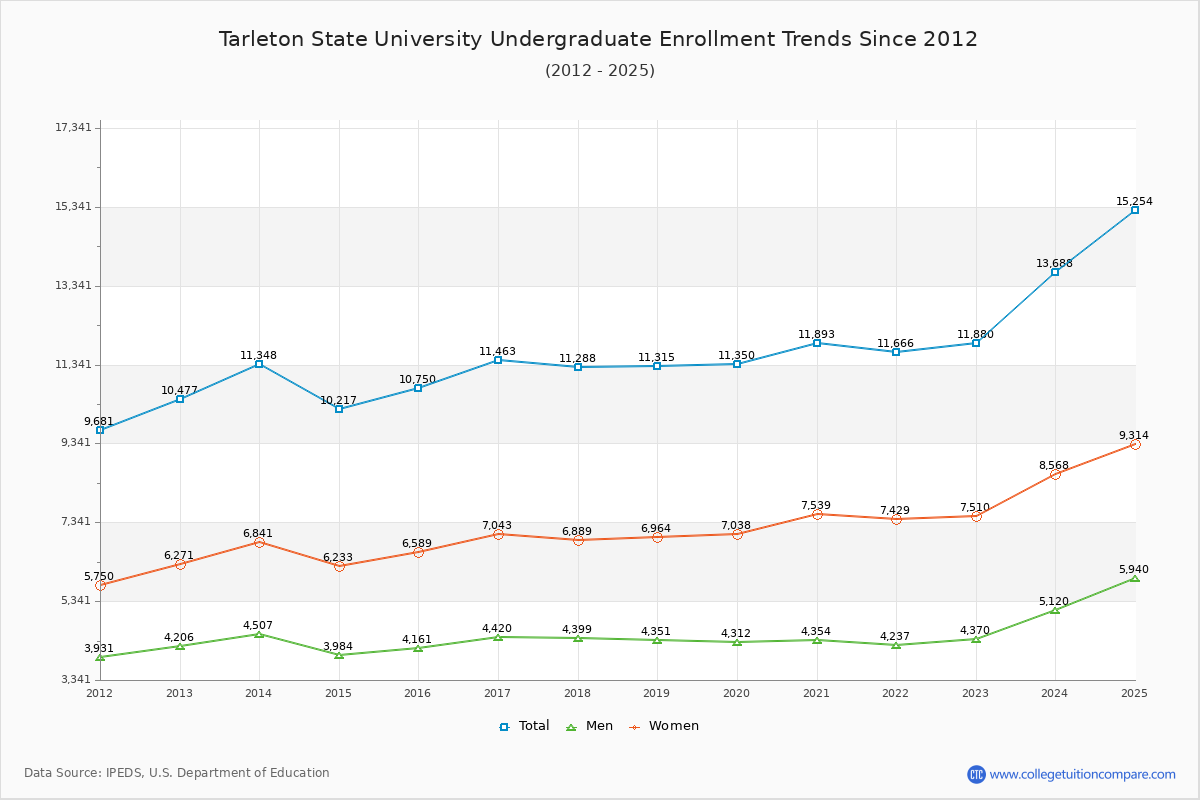
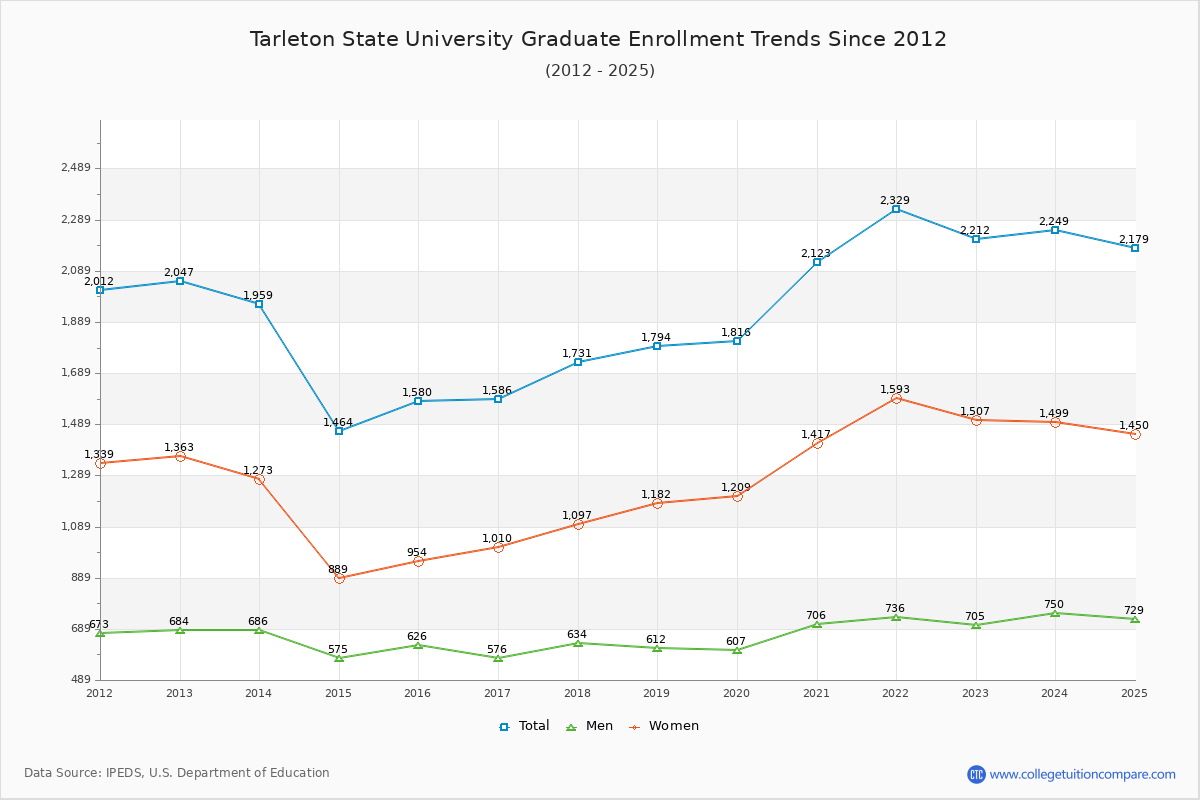
84.30% of total students is undergraduate students and 15.70% students is graduate students. The number of undergraduate students has increased by 1,403 and the graduate enrollment has increased by 165 over past 10 years.
The female to male ratio is 1.78 to 1 and it means that there are more female students enrolled in TSU than male students.
The following table and chart illustrate the changes in student population by gender at Tarleton State University since 2012.
| Year | Total | Undergraduate | Graduate | ||||
|---|---|---|---|---|---|---|---|
| Total | Men | Women | Total | Men | Women | ||
| 2012-13 | 12,524 | 10,477 | 4,206 | 6,271 | 2,047 | 684 | 1,363 |
| 2013-14 | 13,307 783 | 11,348 871 | 4,507 301 | 6,841 570 | 1,959 -88 | 686 2 | 1,273 -90 |
| 2014-15 | 11,681 -1,626 | 10,217 -1,131 | 3,984 -523 | 6,233 -608 | 1,464 -495 | 575 -111 | 889 -384 |
| 2015-16 | 12,330 649 | 10,750 533 | 4,161 177 | 6,589 356 | 1,580 116 | 626 51 | 954 65 |
| 2016-17 | 13,049 719 | 11,463 713 | 4,420 259 | 7,043 454 | 1,586 6 | 576 -50 | 1,010 56 |
| 2017-18 | 13,019 -30 | 11,288 -175 | 4,399 -21 | 6,889 -154 | 1,731 145 | 634 58 | 1,097 87 |
| 2018-19 | 13,109 90 | 11,315 27 | 4,351 -48 | 6,964 75 | 1,794 63 | 612 -22 | 1,182 85 |
| 2019-20 | 13,166 57 | 11,350 35 | 4,312 -39 | 7,038 74 | 1,816 22 | 607 -5 | 1,209 27 |
| 2020-21 | 14,016 850 | 11,893 543 | 4,354 42 | 7,539 501 | 2,123 307 | 706 99 | 1,417 208 |
| 2021-22 | 13,995 -21 | 11,666 -227 | 4,237 -117 | 7,429 -110 | 2,329 206 | 736 30 | 1,593 176 |
| 2022-23 | 14,092 97 | 11,880 214 | 4,370 133 | 7,510 81 | 2,212 -117 | 705 -31 | 1,507 -86 |
| Average | 13,117 | 11,241 | 4,300 | 6,941 | 1,876 | 650 | 1,227 |