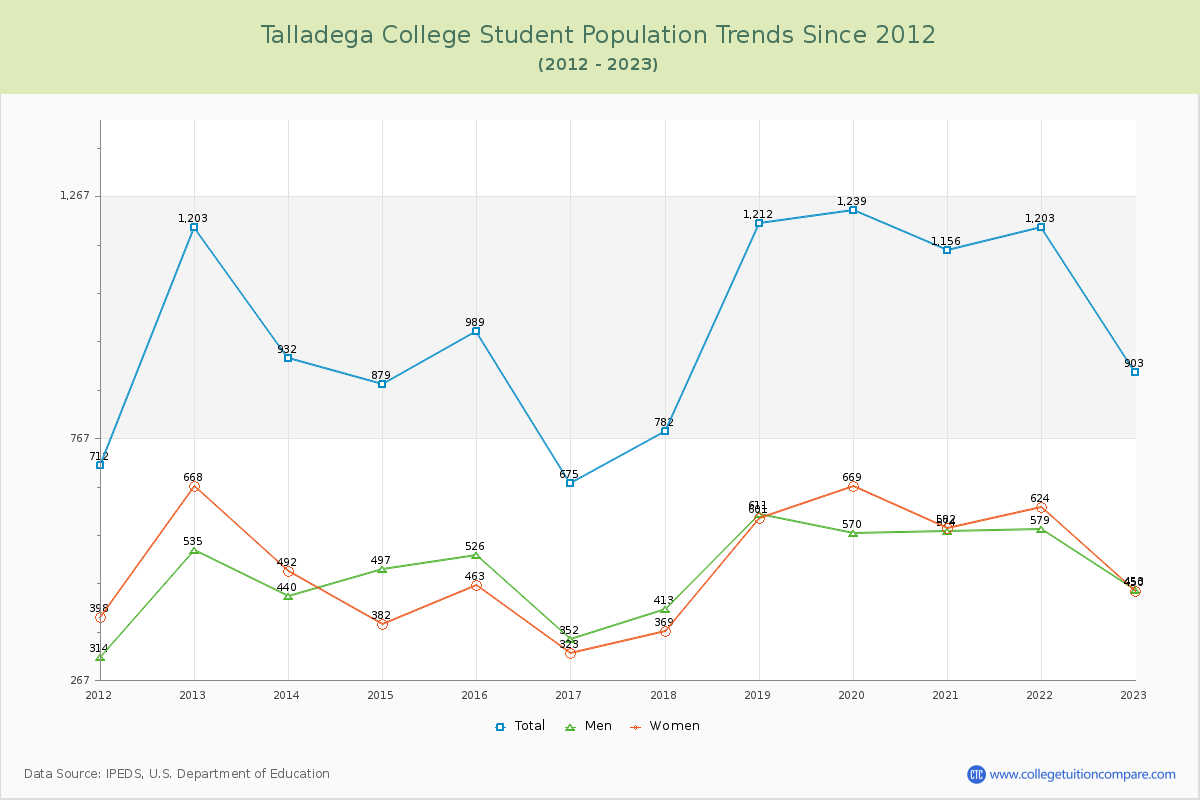
Student Population Changes
The average student population over the last 12 years is 1,016 where 903 students are attending the school for the academic year 2022-2023.
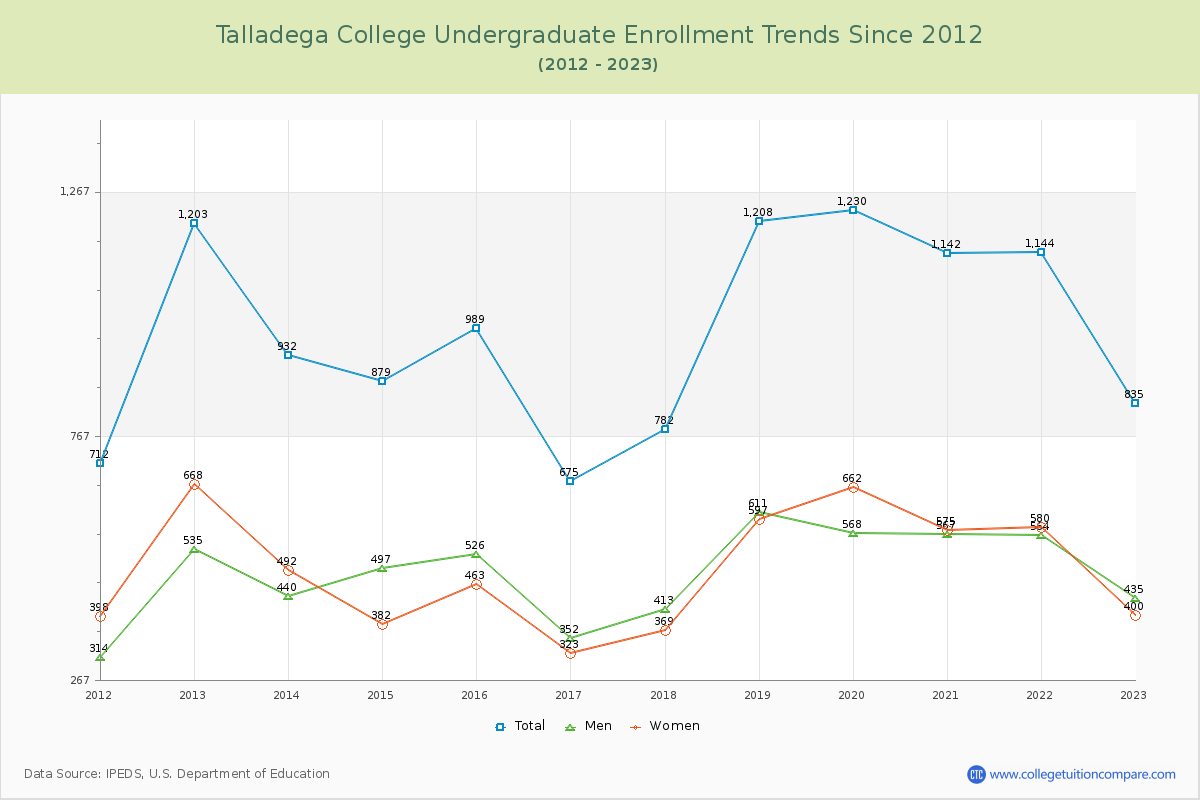
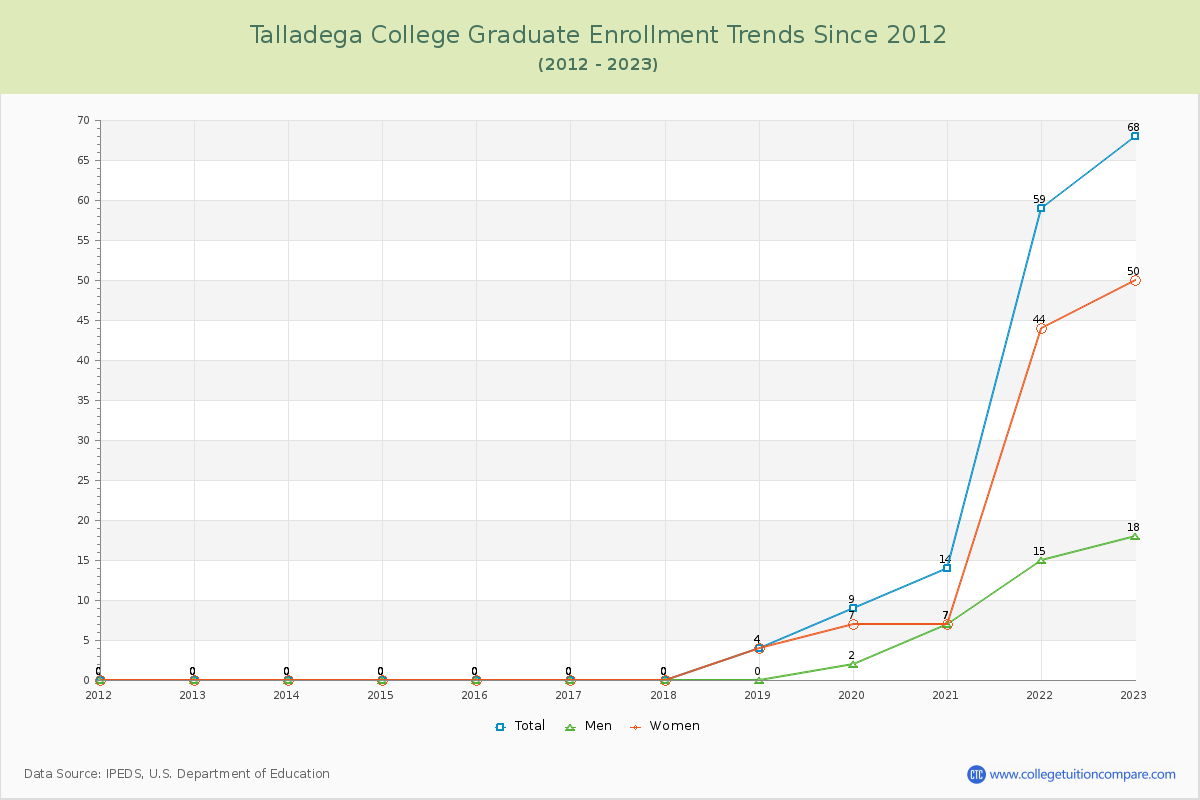
92.47% of total students is undergraduate students and 7.53% students is graduate students. The number of undergraduate students has decreased by 368 and the graduate enrollment has increased by 68 over past 10 years.
The female to male ratio is 0.99 to 1 and it means that there are similar numbers of female and male students enrolled in Talladega.
The following table and chart illustrate the changes in student population by gender at Talladega College since 2012.
| Year | Total | Undergraduate | Graduate | ||||
|---|---|---|---|---|---|---|---|
| Total | Men | Women | Total | Men | Women | ||
| 2012-13 | 1,203 | 1,203 | 535 | 668 | 0 | 0 | 0 |
| 2013-14 | 932 -271 | 932 -271 | 440 -95 | 492 -176 | 0 0 | 0 0 | 0 0 |
| 2014-15 | 879 -53 | 879 -53 | 497 57 | 382 -110 | 0 0 | 0 0 | 0 0 |
| 2015-16 | 989 110 | 989 110 | 526 29 | 463 81 | 0 0 | 0 0 | 0 0 |
| 2016-17 | 675 -314 | 675 -314 | 352 -174 | 323 -140 | 0 0 | 0 0 | 0 0 |
| 2017-18 | 782 107 | 782 107 | 413 61 | 369 46 | 0 0 | 0 0 | 0 0 |
| 2018-19 | 1,212 430 | 1,208 426 | 611 198 | 597 228 | 4 4 | 0 0 | 4 4 |
| 2019-20 | 1,239 27 | 1,230 22 | 568 -43 | 662 65 | 9 5 | 2 2 | 7 3 |
| 2020-21 | 1,156 -83 | 1,142 -88 | 567 -1 | 575 -87 | 14 5 | 7 5 | 7 0 |
| 2021-22 | 1,203 47 | 1,144 2 | 564 -3 | 580 5 | 59 45 | 15 8 | 44 37 |
| 2022-23 | 903 -300 | 835 -309 | 435 -129 | 400 -180 | 68 9 | 18 3 | 50 6 |
| Average | 1,016 | 1,002 | 501 | 501 | 14 | 4 | 10 |