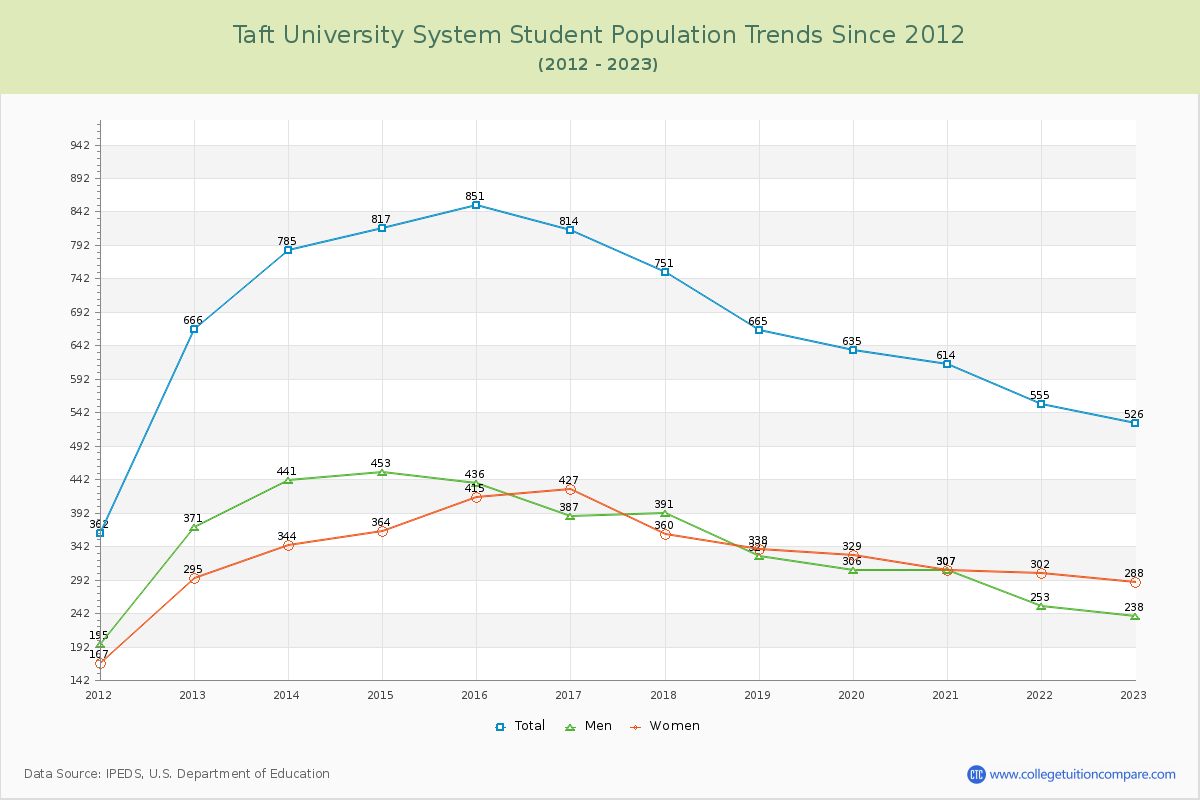
Student Population Changes
The average student population over the last 12 years is 698 where 526 students are attending the school for the academic year 2022-2023.
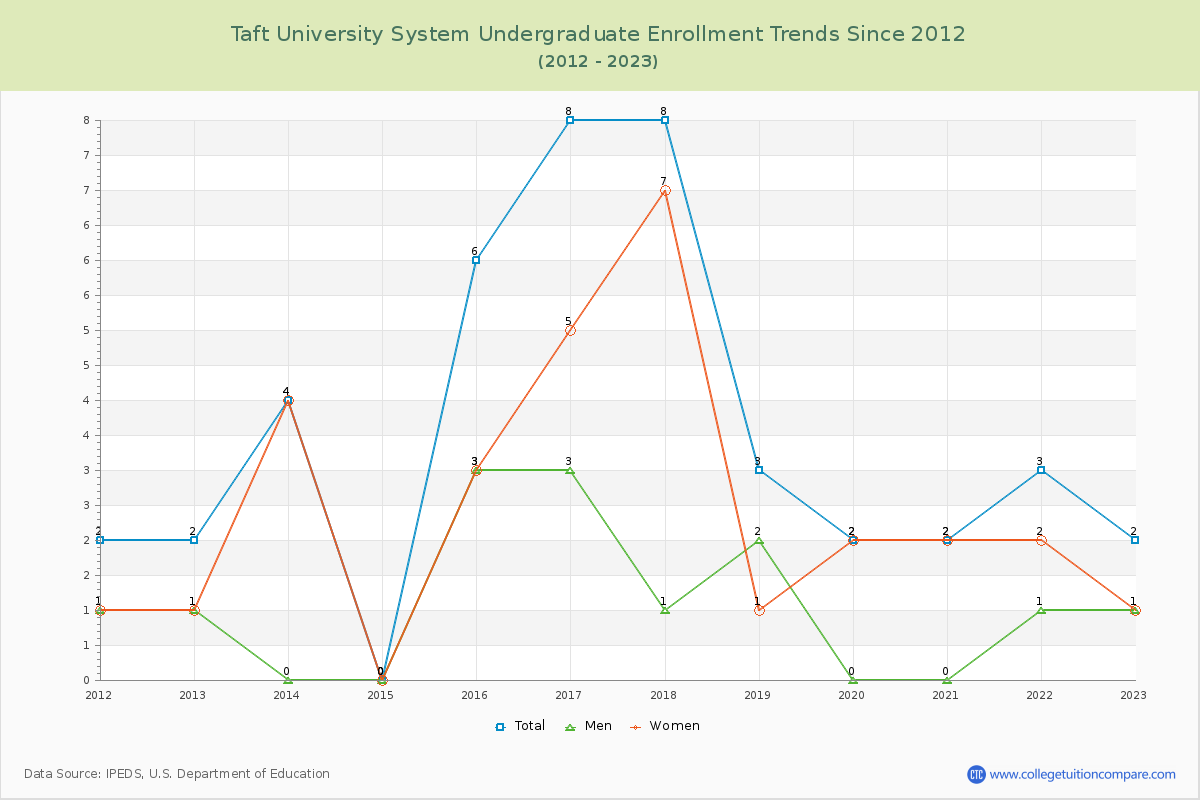
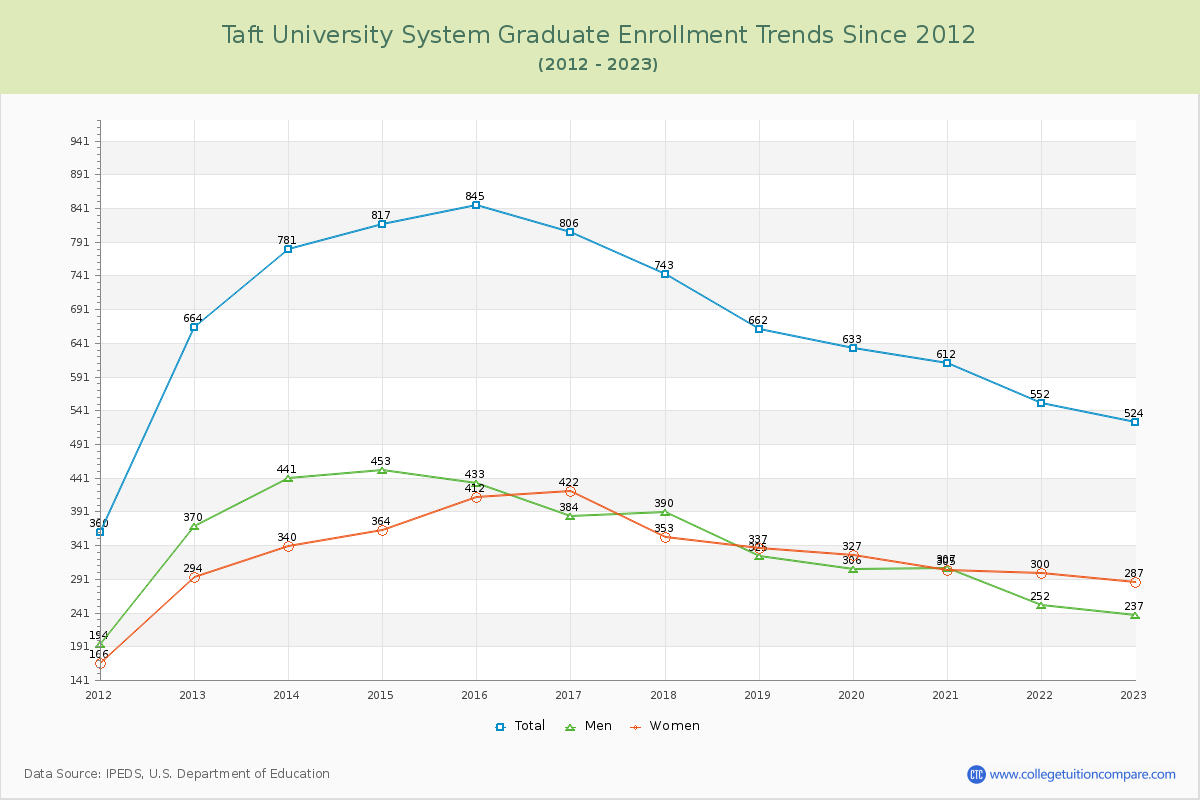
0.38% of total students is undergraduate students and 99.62% students is graduate students. The number of undergraduate students has decreased by 0 and the graduate enrollment has decreased by 140 over past 10 years.
The female to male ratio is 1.21 to 1 and it means that there are slightly more female students enrolled in Taft University System than male students.
The following table and chart illustrate the changes in student population by gender at Taft University System since 2012.
| Year | Total | Undergraduate | Graduate | ||||
|---|---|---|---|---|---|---|---|
| Total | Men | Women | Total | Men | Women | ||
| 2012-13 | 666 | 2 | 1 | 1 | 664 | 370 | 294 |
| 2013-14 | 785 119 | 4 2 | 0 -1 | 4 3 | 781 117 | 441 71 | 340 46 |
| 2014-15 | 817 32 | 0 -4 | 0 0 | 0 -4 | 817 36 | 453 12 | 364 24 |
| 2015-16 | 851 34 | 6 6 | 3 3 | 3 3 | 845 28 | 433 -20 | 412 48 |
| 2016-17 | 814 -37 | 8 2 | 3 0 | 5 2 | 806 -39 | 384 -49 | 422 10 |
| 2017-18 | 751 -63 | 8 0 | 1 -2 | 7 2 | 743 -63 | 390 6 | 353 -69 |
| 2018-19 | 665 -86 | 3 -5 | 2 1 | 1 -6 | 662 -81 | 325 -65 | 337 -16 |
| 2019-20 | 635 -30 | 2 -1 | 0 -2 | 2 1 | 633 -29 | 306 -19 | 327 -10 |
| 2020-21 | 614 -21 | 2 0 | 0 0 | 2 0 | 612 -21 | 307 1 | 305 -22 |
| 2021-22 | 555 -59 | 3 1 | 1 1 | 2 0 | 552 -60 | 252 -55 | 300 -5 |
| 2022-23 | 526 -29 | 2 -1 | 1 0 | 1 -1 | 524 -28 | 237 -15 | 287 -13 |
| Average | 698 | 4 | 1 | 3 | 694 | 354 | 340 |