Student Population Changes
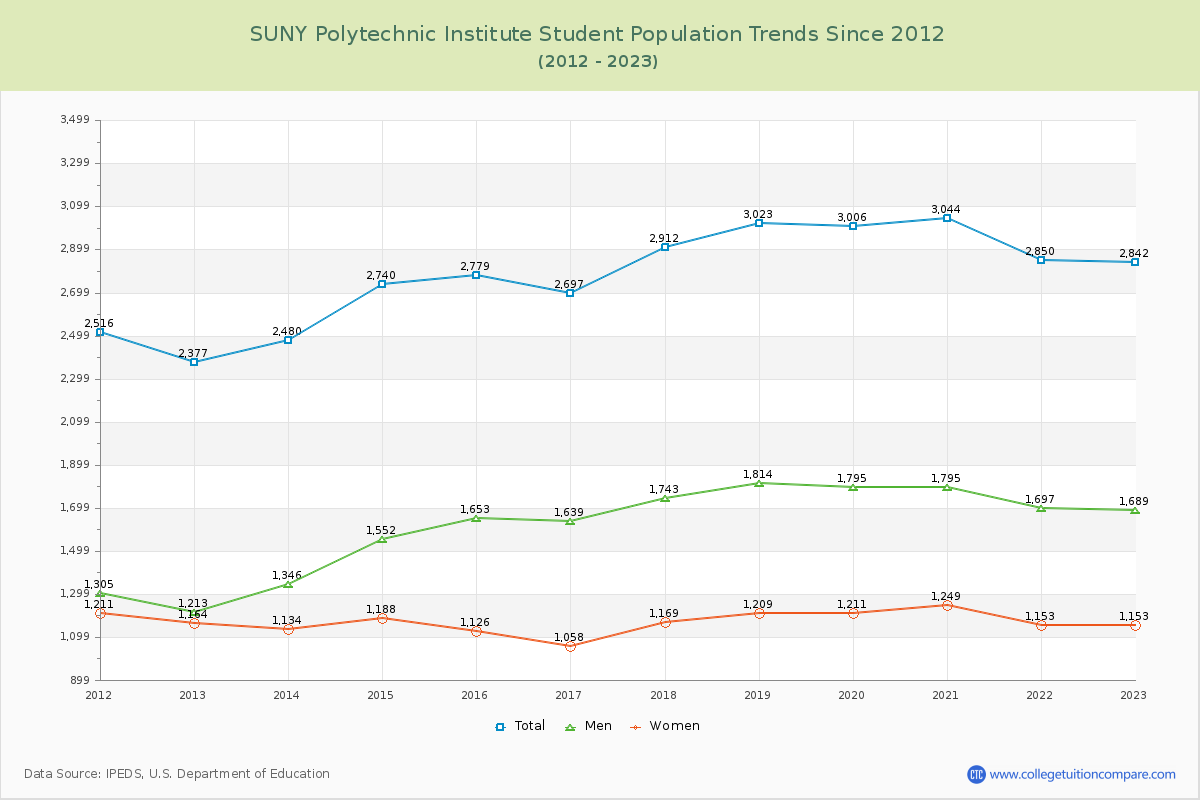
The average student population over the last 12 years is 2,795 where 2,842 students are attending the school for the academic year 2022-2023.
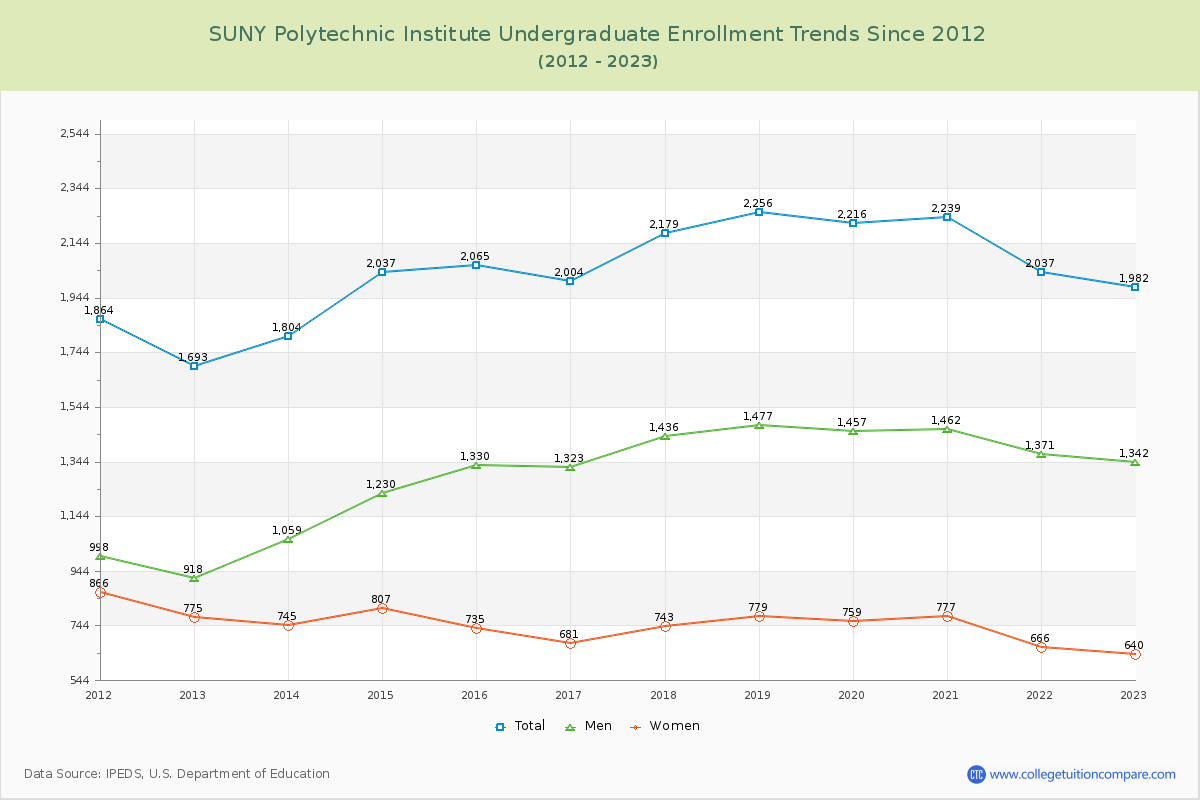
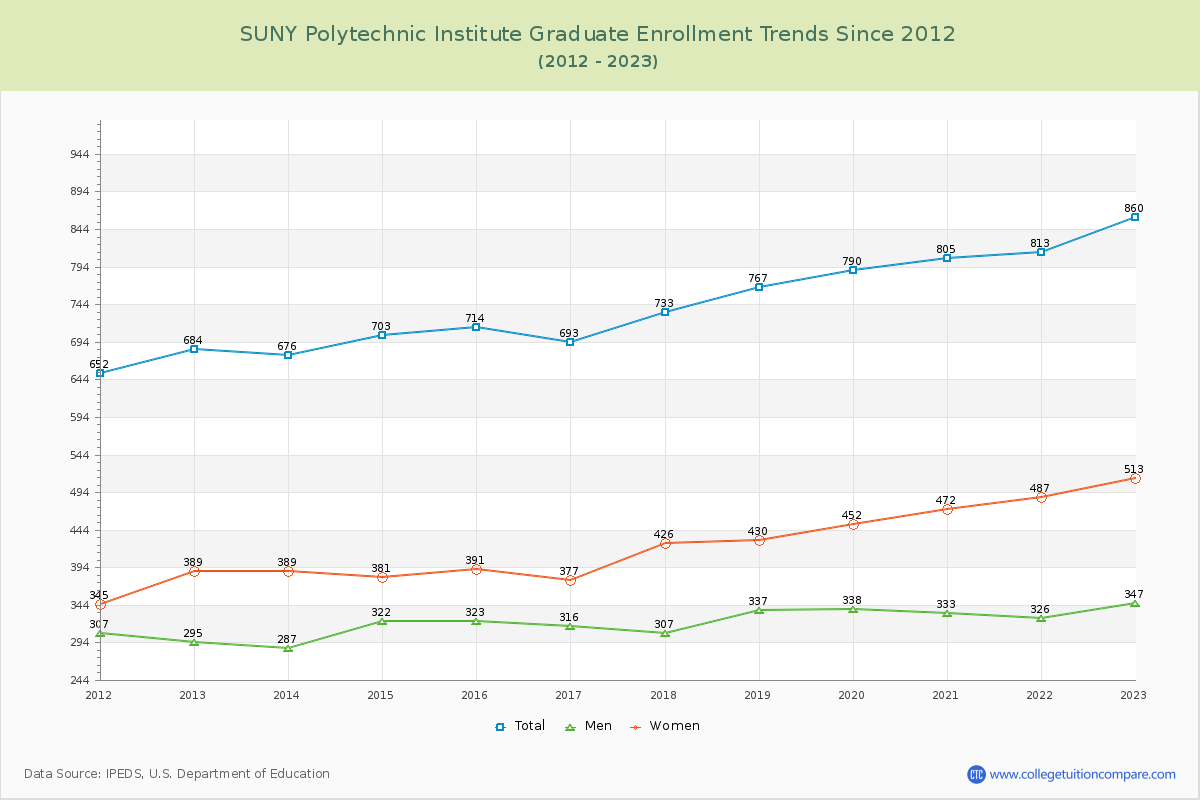
69.74% of total students is undergraduate students and 30.26% students is graduate students. The number of undergraduate students has increased by 289 and the graduate enrollment has increased by 176 over past 10 years.
The female to male ratio is 0.68 to 1 and it means that there are more male students enrolled in SUNY Poly than female students.
The following table and chart illustrate the changes in student population by gender at SUNY Polytechnic Institute since 2012.
| Year | Total | Undergraduate | Graduate | ||||
|---|---|---|---|---|---|---|---|
| Total | Men | Women | Total | Men | Women | ||
| 2012-13 | 2,377 | 1,693 | 918 | 775 | 684 | 295 | 389 |
| 2013-14 | 2,480 103 | 1,804 111 | 1,059 141 | 745 -30 | 676 -8 | 287 -8 | 389 0 |
| 2014-15 | 2,740 260 | 2,037 233 | 1,230 171 | 807 62 | 703 27 | 322 35 | 381 -8 |
| 2015-16 | 2,779 39 | 2,065 28 | 1,330 100 | 735 -72 | 714 11 | 323 1 | 391 10 |
| 2016-17 | 2,697 -82 | 2,004 -61 | 1,323 -7 | 681 -54 | 693 -21 | 316 -7 | 377 -14 |
| 2017-18 | 2,912 215 | 2,179 175 | 1,436 113 | 743 62 | 733 40 | 307 -9 | 426 49 |
| 2018-19 | 3,023 111 | 2,256 77 | 1,477 41 | 779 36 | 767 34 | 337 30 | 430 4 |
| 2019-20 | 3,006 -17 | 2,216 -40 | 1,457 -20 | 759 -20 | 790 23 | 338 1 | 452 22 |
| 2020-21 | 3,044 38 | 2,239 23 | 1,462 5 | 777 18 | 805 15 | 333 -5 | 472 20 |
| 2021-22 | 2,850 -194 | 2,037 -202 | 1,371 -91 | 666 -111 | 813 8 | 326 -7 | 487 15 |
| 2022-23 | 2,842 -8 | 1,982 -55 | 1,342 -29 | 640 -26 | 860 47 | 347 21 | 513 26 |
| Average | 2,795 | 2,047 | 1,310 | 737 | 749 | 321 | 428 |