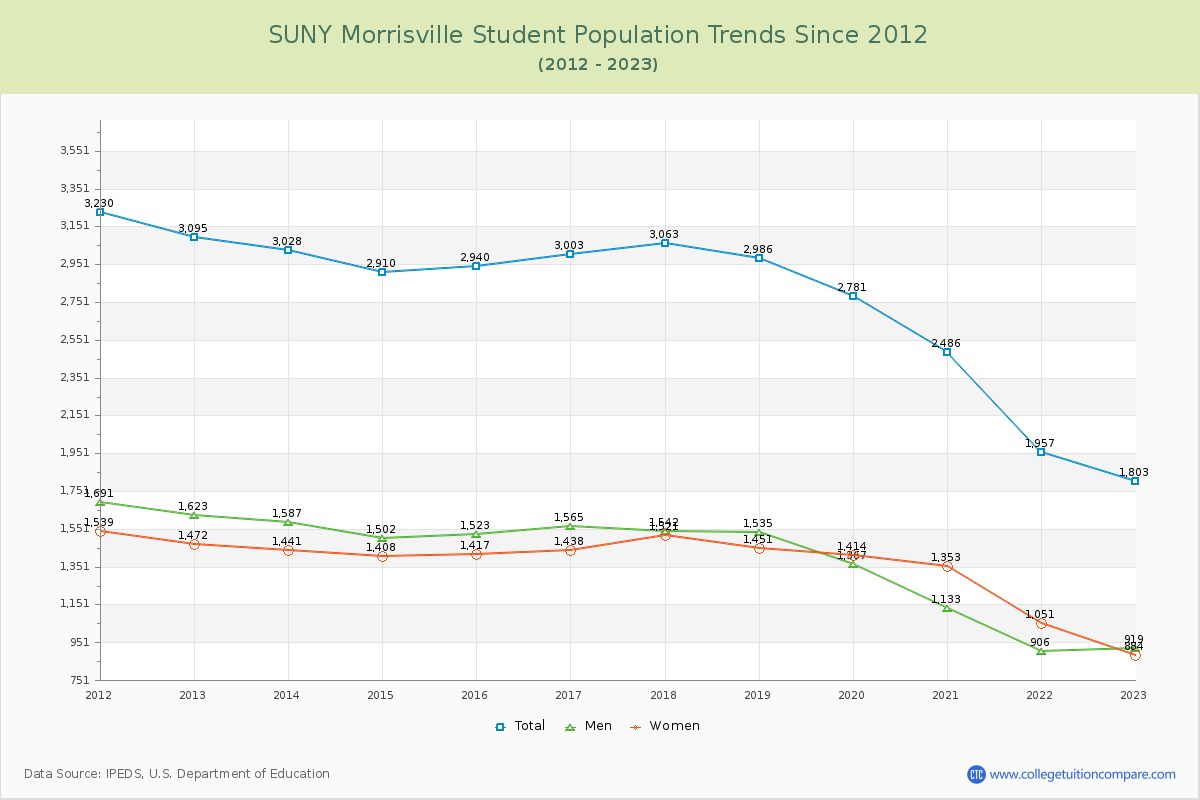
Student Population Changes
The average student population over the last 12 years is 2,732 where 1,803 students are attending the school for the academic year 2022-2023.
The female to male ratio is 0.96 to 1 and it means that there are similar numbers of female and male students enrolled in SUNY Morrisville.
The following table and chart illustrate the changes in student population by gender at SUNY Morrisville since 2012.
| Year | Total | Men | Women |
|---|---|---|---|
| 2012-13 | 3,095 | 1,623 | 1,472 |
| 2013-14 | 3,028 -67 | 1,587 -36 | 1,441 -31 |
| 2014-15 | 2,910 -118 | 1,502 -85 | 1,408 -33 |
| 2015-16 | 2,940 30 | 1,523 21 | 1,417 9 |
| 2016-17 | 3,003 63 | 1,565 42 | 1,438 21 |
| 2017-18 | 3,063 60 | 1,542 -23 | 1,521 83 |
| 2018-19 | 2,986 -77 | 1,535 -7 | 1,451 -70 |
| 2019-20 | 2,781 -205 | 1,367 -168 | 1,414 -37 |
| 2020-21 | 2,486 -295 | 1,133 -234 | 1,353 -61 |
| 2021-22 | 1,957 -529 | 906 -227 | 1,051 -302 |
| 2022-23 | 1,803 -154 | 919 13 | 884 -167 |
| Average | 2,732 | 1,382 | 1,350 |