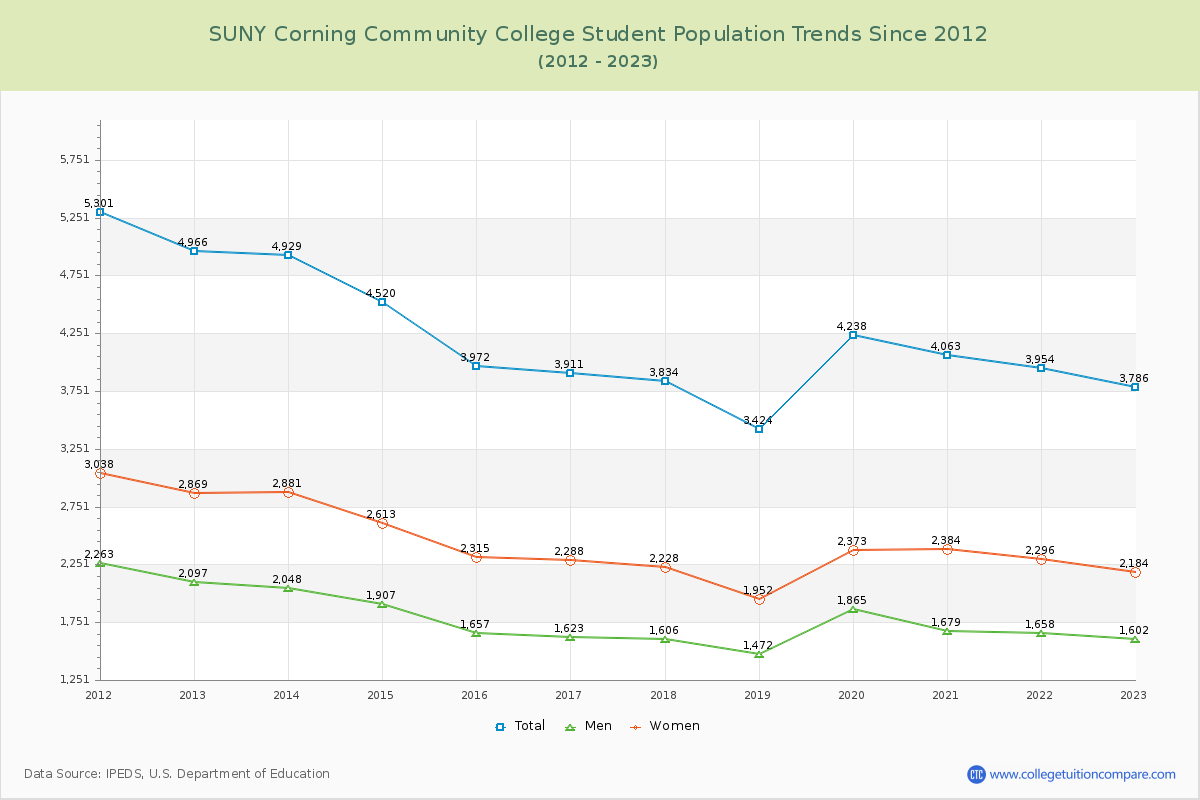
Student Population Changes
The average student population over the last 12 years is 4,145 where 3,786 students are attending the school for the academic year 2022-2023.
The female to male ratio is 1.36 to 1 and it means that there are more female students enrolled in SUNY Corning CC than male students.
The following table and chart illustrate the changes in student population by gender at SUNY Corning Community College since 2012.
| Year | Total | Men | Women |
|---|---|---|---|
| 2012-13 | 4,966 | 2,097 | 2,869 |
| 2013-14 | 4,929 -37 | 2,048 -49 | 2,881 12 |
| 2014-15 | 4,520 -409 | 1,907 -141 | 2,613 -268 |
| 2015-16 | 3,972 -548 | 1,657 -250 | 2,315 -298 |
| 2016-17 | 3,911 -61 | 1,623 -34 | 2,288 -27 |
| 2017-18 | 3,834 -77 | 1,606 -17 | 2,228 -60 |
| 2018-19 | 3,424 -410 | 1,472 -134 | 1,952 -276 |
| 2019-20 | 4,238 814 | 1,865 393 | 2,373 421 |
| 2020-21 | 4,063 -175 | 1,679 -186 | 2,384 11 |
| 2021-22 | 3,954 -109 | 1,658 -21 | 2,296 -88 |
| 2022-23 | 3,786 -168 | 1,602 -56 | 2,184 -112 |
| Average | 4,145 | 1,747 | 2,398 |