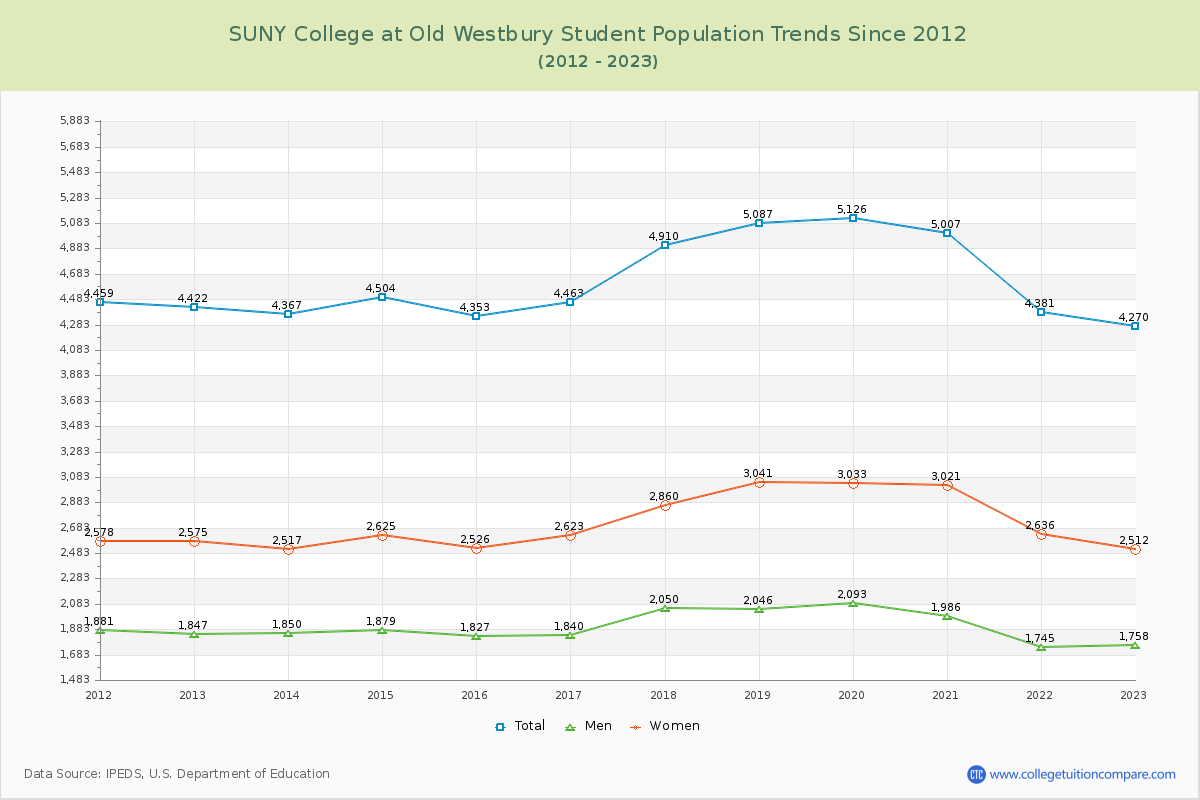
Student Population Changes
The average student population over the last 12 years is 4,626 where 4,270 students are attending the school for the academic year 2022-2023.
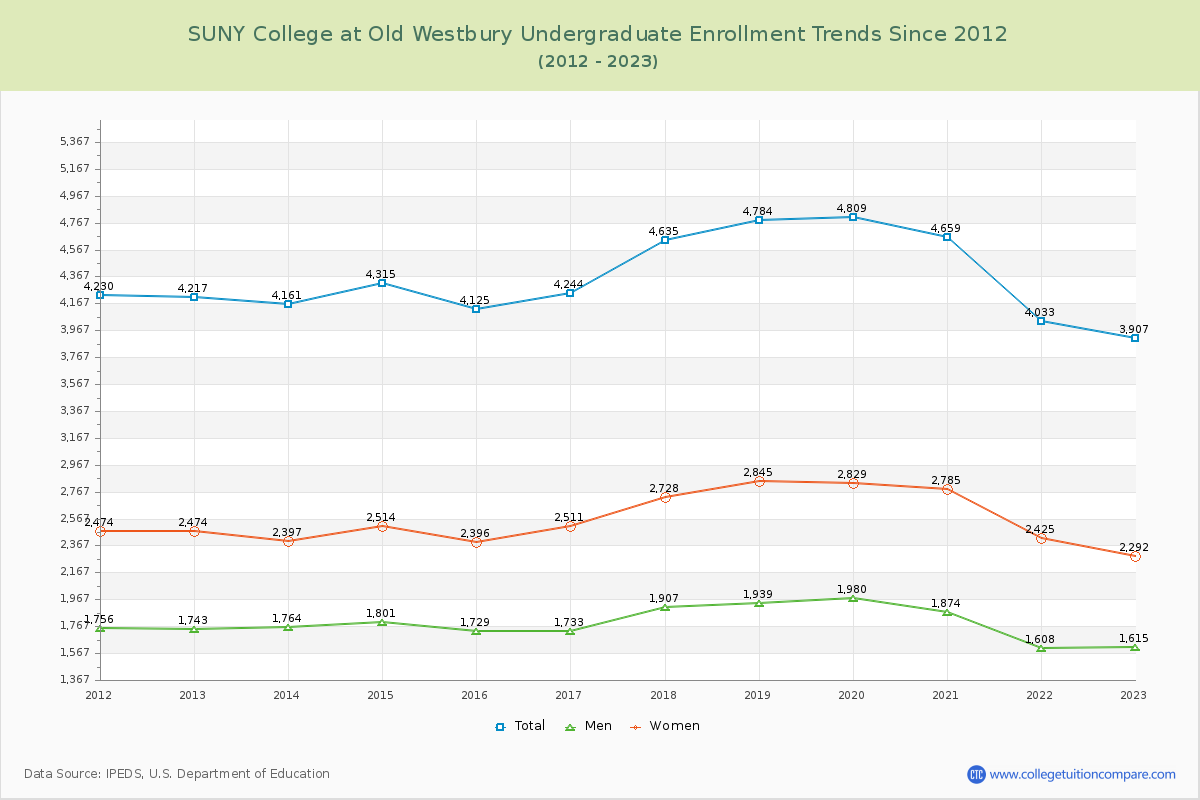
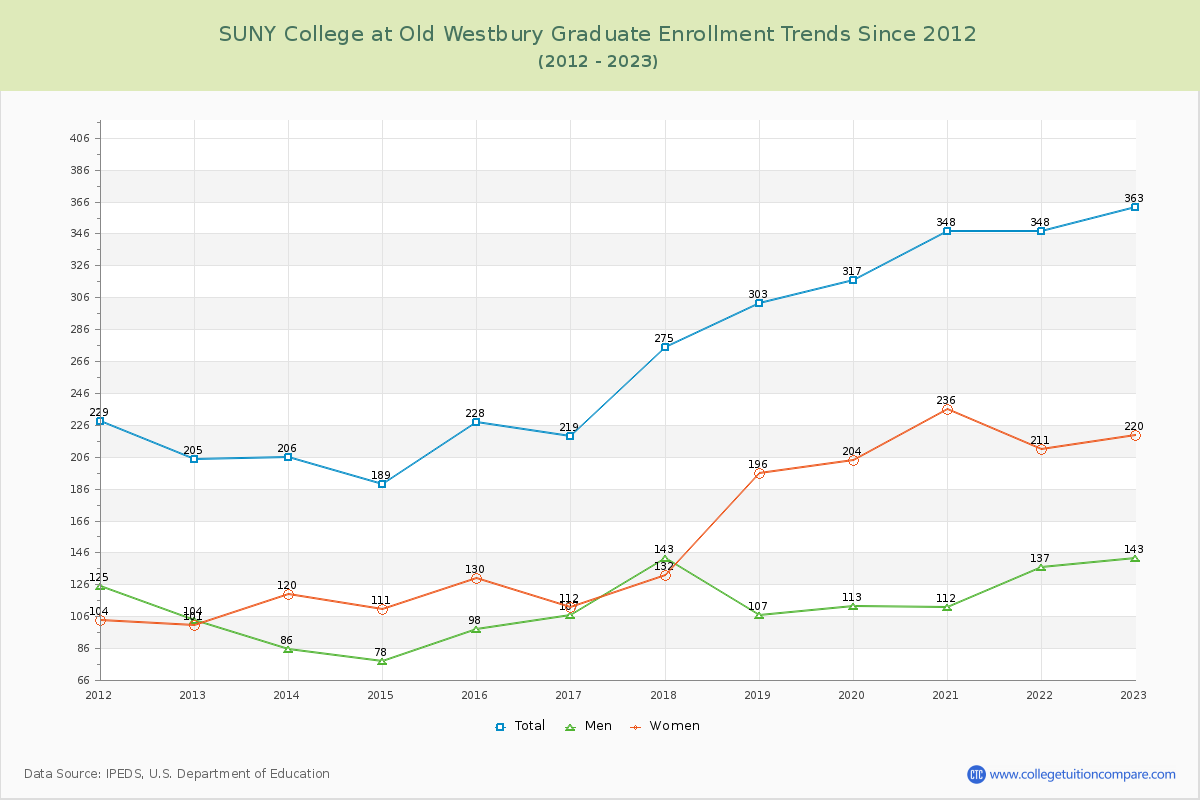
91.50% of total students is undergraduate students and 8.50% students is graduate students. The number of undergraduate students has decreased by 310 and the graduate enrollment has increased by 158 over past 10 years.
The female to male ratio is 1.43 to 1 and it means that there are more female students enrolled in SUNY College at Old Westbury than male students.
The following table and chart illustrate the changes in student population by gender at SUNY College at Old Westbury since 2012.
| Year | Total | Undergraduate | Graduate | ||||
|---|---|---|---|---|---|---|---|
| Total | Men | Women | Total | Men | Women | ||
| 2012-13 | 4,422 | 4,217 | 1,743 | 2,474 | 205 | 104 | 101 |
| 2013-14 | 4,367 -55 | 4,161 -56 | 1,764 21 | 2,397 -77 | 206 1 | 86 -18 | 120 19 |
| 2014-15 | 4,504 137 | 4,315 154 | 1,801 37 | 2,514 117 | 189 -17 | 78 -8 | 111 -9 |
| 2015-16 | 4,353 -151 | 4,125 -190 | 1,729 -72 | 2,396 -118 | 228 39 | 98 20 | 130 19 |
| 2016-17 | 4,463 110 | 4,244 119 | 1,733 4 | 2,511 115 | 219 -9 | 107 9 | 112 -18 |
| 2017-18 | 4,910 447 | 4,635 391 | 1,907 174 | 2,728 217 | 275 56 | 143 36 | 132 20 |
| 2018-19 | 5,087 177 | 4,784 149 | 1,939 32 | 2,845 117 | 303 28 | 107 -36 | 196 64 |
| 2019-20 | 5,126 39 | 4,809 25 | 1,980 41 | 2,829 -16 | 317 14 | 113 6 | 204 8 |
| 2020-21 | 5,007 -119 | 4,659 -150 | 1,874 -106 | 2,785 -44 | 348 31 | 112 -1 | 236 32 |
| 2021-22 | 4,381 -626 | 4,033 -626 | 1,608 -266 | 2,425 -360 | 348 0 | 137 25 | 211 -25 |
| 2022-23 | 4,270 -111 | 3,907 -126 | 1,615 7 | 2,292 -133 | 363 15 | 143 6 | 220 9 |
| Average | 4,626 | 4,354 | 1,790 | 2,563 | 273 | 112 | 161 |