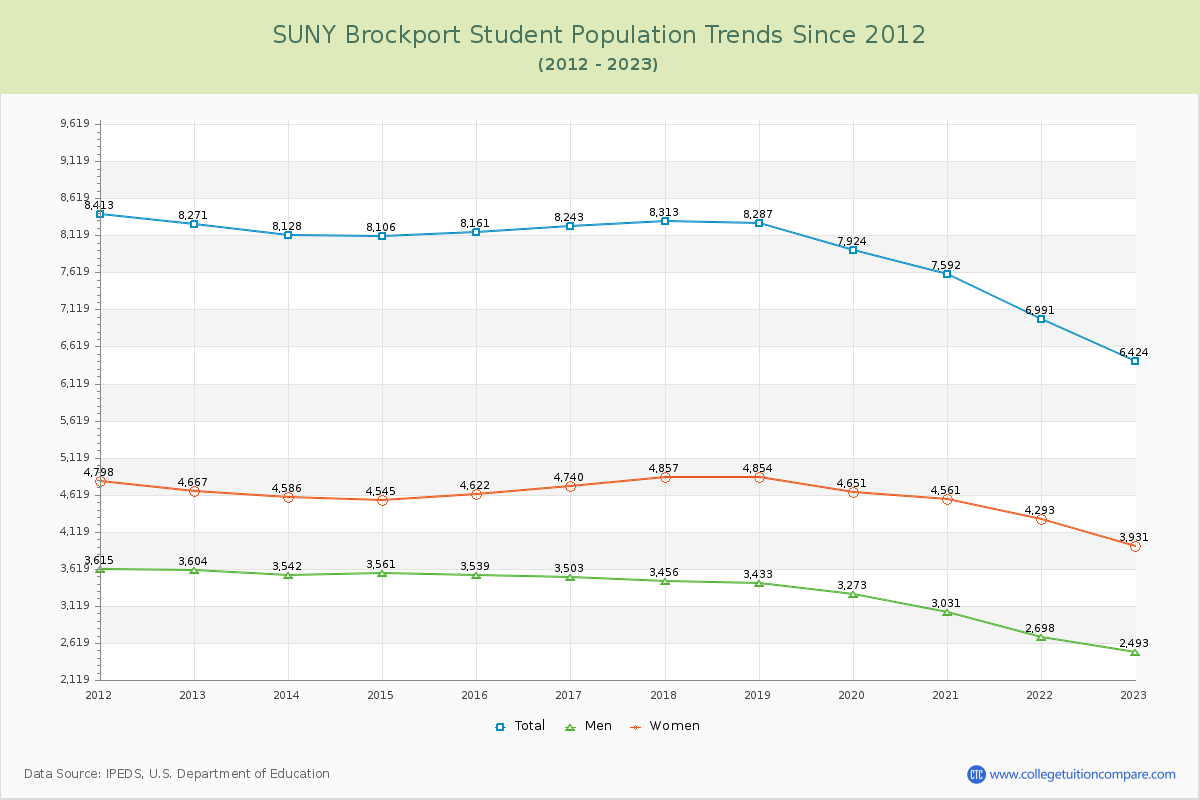
Student Population Changes
The average student population over the last 12 years is 7,858 where 6,424 students are attending the school for the academic year 2022-2023.
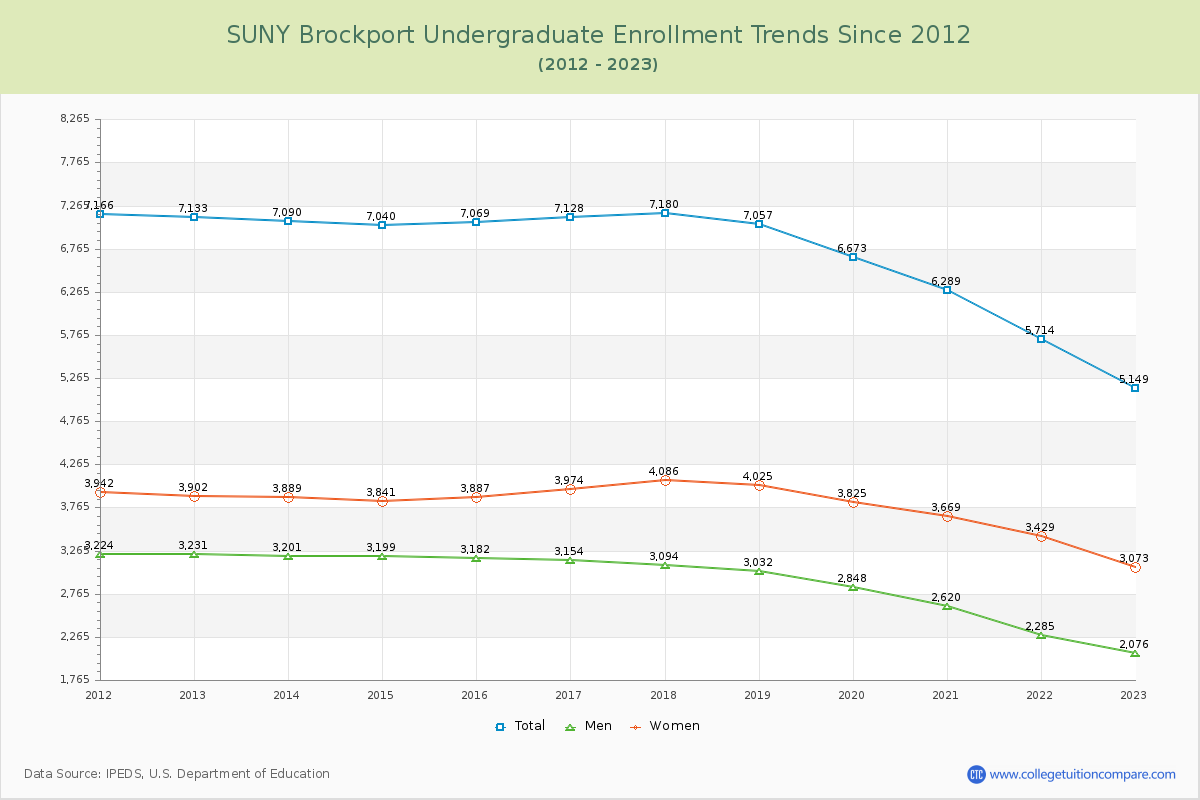
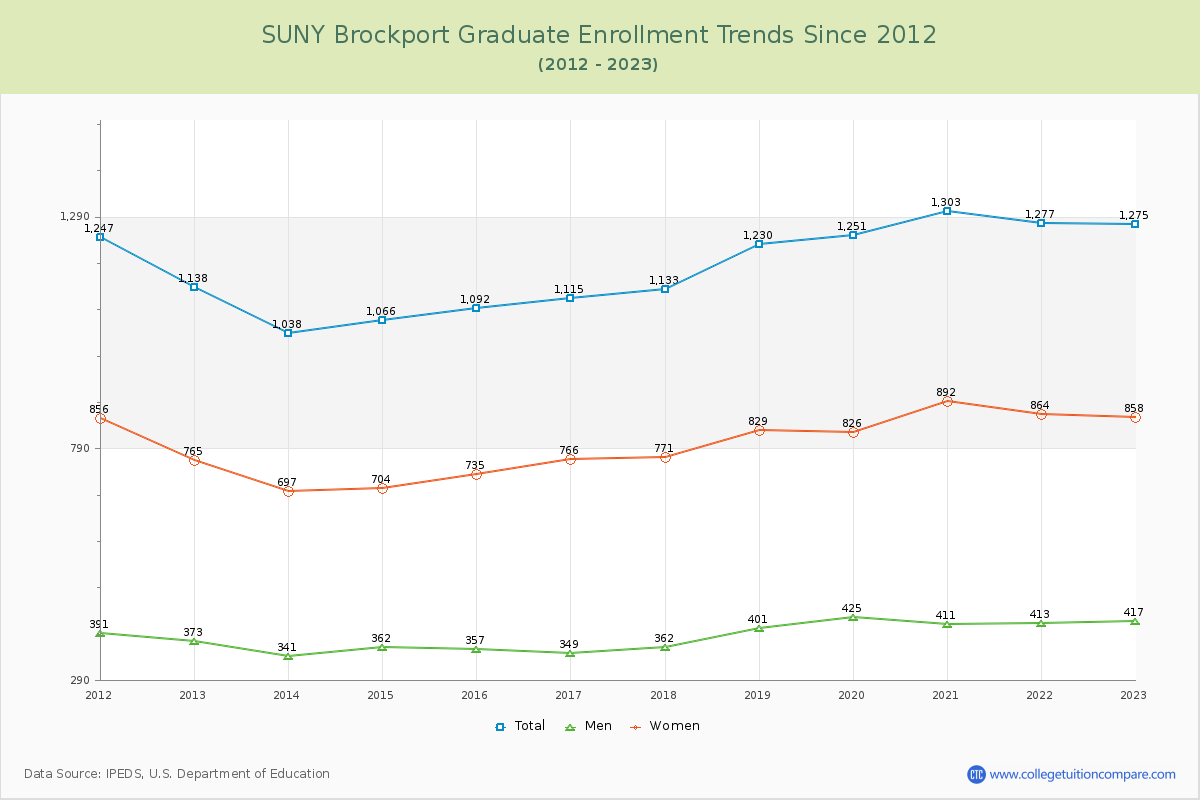
80.15% of total students is undergraduate students and 19.85% students is graduate students. The number of undergraduate students has decreased by 1,984 and the graduate enrollment has increased by 137 over past 10 years.
The female to male ratio is 1.58 to 1 and it means that there are more female students enrolled in SUNY Brockport than male students.
The following table and chart illustrate the changes in student population by gender at SUNY Brockport since 2012.
| Year | Total | Undergraduate | Graduate | ||||
|---|---|---|---|---|---|---|---|
| Total | Men | Women | Total | Men | Women | ||
| 2012-13 | 8,271 | 7,133 | 3,231 | 3,902 | 1,138 | 373 | 765 |
| 2013-14 | 8,128 -143 | 7,090 -43 | 3,201 -30 | 3,889 -13 | 1,038 -100 | 341 -32 | 697 -68 |
| 2014-15 | 8,106 -22 | 7,040 -50 | 3,199 -2 | 3,841 -48 | 1,066 28 | 362 21 | 704 7 |
| 2015-16 | 8,161 55 | 7,069 29 | 3,182 -17 | 3,887 46 | 1,092 26 | 357 -5 | 735 31 |
| 2016-17 | 8,243 82 | 7,128 59 | 3,154 -28 | 3,974 87 | 1,115 23 | 349 -8 | 766 31 |
| 2017-18 | 8,313 70 | 7,180 52 | 3,094 -60 | 4,086 112 | 1,133 18 | 362 13 | 771 5 |
| 2018-19 | 8,287 -26 | 7,057 -123 | 3,032 -62 | 4,025 -61 | 1,230 97 | 401 39 | 829 58 |
| 2019-20 | 7,924 -363 | 6,673 -384 | 2,848 -184 | 3,825 -200 | 1,251 21 | 425 24 | 826 -3 |
| 2020-21 | 7,592 -332 | 6,289 -384 | 2,620 -228 | 3,669 -156 | 1,303 52 | 411 -14 | 892 66 |
| 2021-22 | 6,991 -601 | 5,714 -575 | 2,285 -335 | 3,429 -240 | 1,277 -26 | 413 2 | 864 -28 |
| 2022-23 | 6,424 -567 | 5,149 -565 | 2,076 -209 | 3,073 -356 | 1,275 -2 | 417 4 | 858 -6 |
| Average | 7,858 | 6,684 | 2,902 | 3,782 | 1,174 | 383 | 792 |