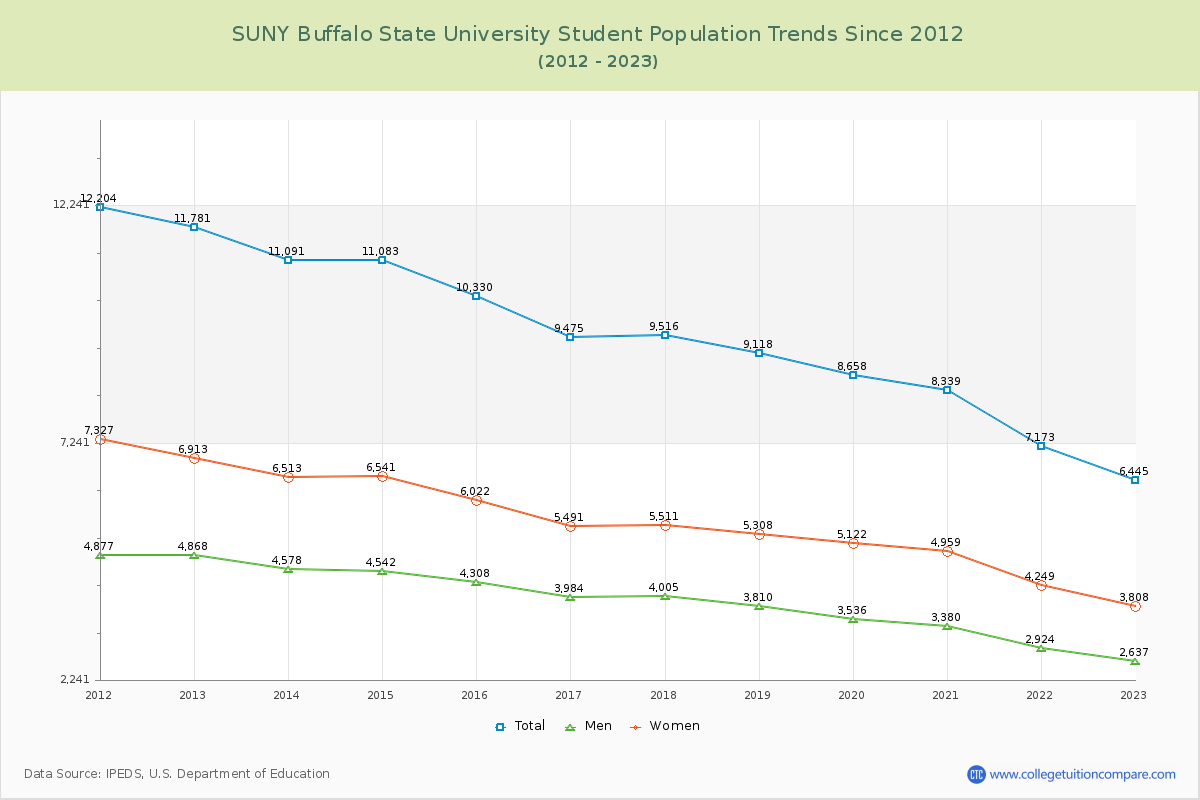
Student Population Changes
The average student population over the last 12 years is 9,364 where 6,445 students are attending the school for the academic year 2022-2023.
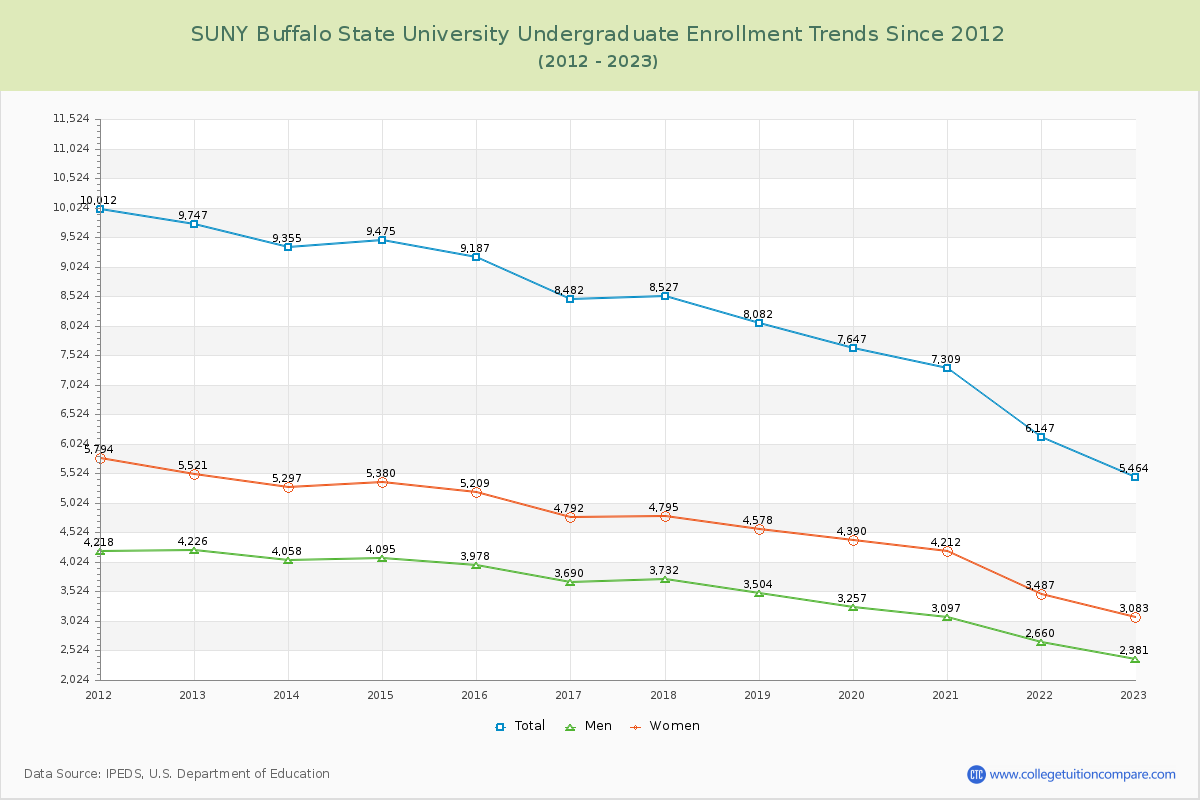
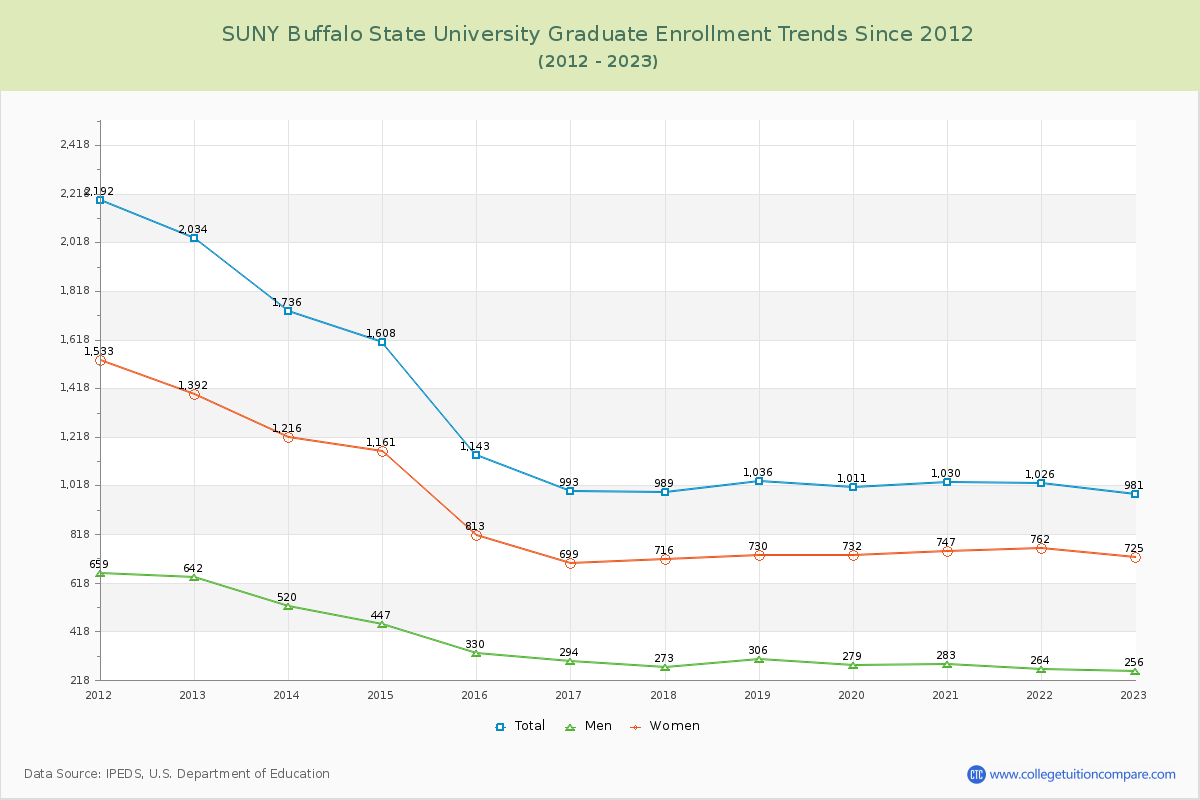
84.78% of total students is undergraduate students and 15.22% students is graduate students. The number of undergraduate students has decreased by 4,283 and the graduate enrollment has decreased by 1,053 over past 10 years.
The female to male ratio is 1.44 to 1 and it means that there are more female students enrolled in Buffalo State than male students.
The following table and chart illustrate the changes in student population by gender at SUNY Buffalo State University since 2012.
| Year | Total | Undergraduate | Graduate | ||||
|---|---|---|---|---|---|---|---|
| Total | Men | Women | Total | Men | Women | ||
| 2012-13 | 11,781 | 9,747 | 4,226 | 5,521 | 2,034 | 642 | 1,392 |
| 2013-14 | 11,091 -690 | 9,355 -392 | 4,058 -168 | 5,297 -224 | 1,736 -298 | 520 -122 | 1,216 -176 |
| 2014-15 | 11,083 -8 | 9,475 120 | 4,095 37 | 5,380 83 | 1,608 -128 | 447 -73 | 1,161 -55 |
| 2015-16 | 10,330 -753 | 9,187 -288 | 3,978 -117 | 5,209 -171 | 1,143 -465 | 330 -117 | 813 -348 |
| 2016-17 | 9,475 -855 | 8,482 -705 | 3,690 -288 | 4,792 -417 | 993 -150 | 294 -36 | 699 -114 |
| 2017-18 | 9,516 41 | 8,527 45 | 3,732 42 | 4,795 3 | 989 -4 | 273 -21 | 716 17 |
| 2018-19 | 9,118 -398 | 8,082 -445 | 3,504 -228 | 4,578 -217 | 1,036 47 | 306 33 | 730 14 |
| 2019-20 | 8,658 -460 | 7,647 -435 | 3,257 -247 | 4,390 -188 | 1,011 -25 | 279 -27 | 732 2 |
| 2020-21 | 8,339 -319 | 7,309 -338 | 3,097 -160 | 4,212 -178 | 1,030 19 | 283 4 | 747 15 |
| 2021-22 | 7,173 -1,166 | 6,147 -1,162 | 2,660 -437 | 3,487 -725 | 1,026 -4 | 264 -19 | 762 15 |
| 2022-23 | 6,445 -728 | 5,464 -683 | 2,381 -279 | 3,083 -404 | 981 -45 | 256 -8 | 725 -37 |
| Average | 9,364 | 8,129 | 3,516 | 4,613 | 1,235 | 354 | 881 |