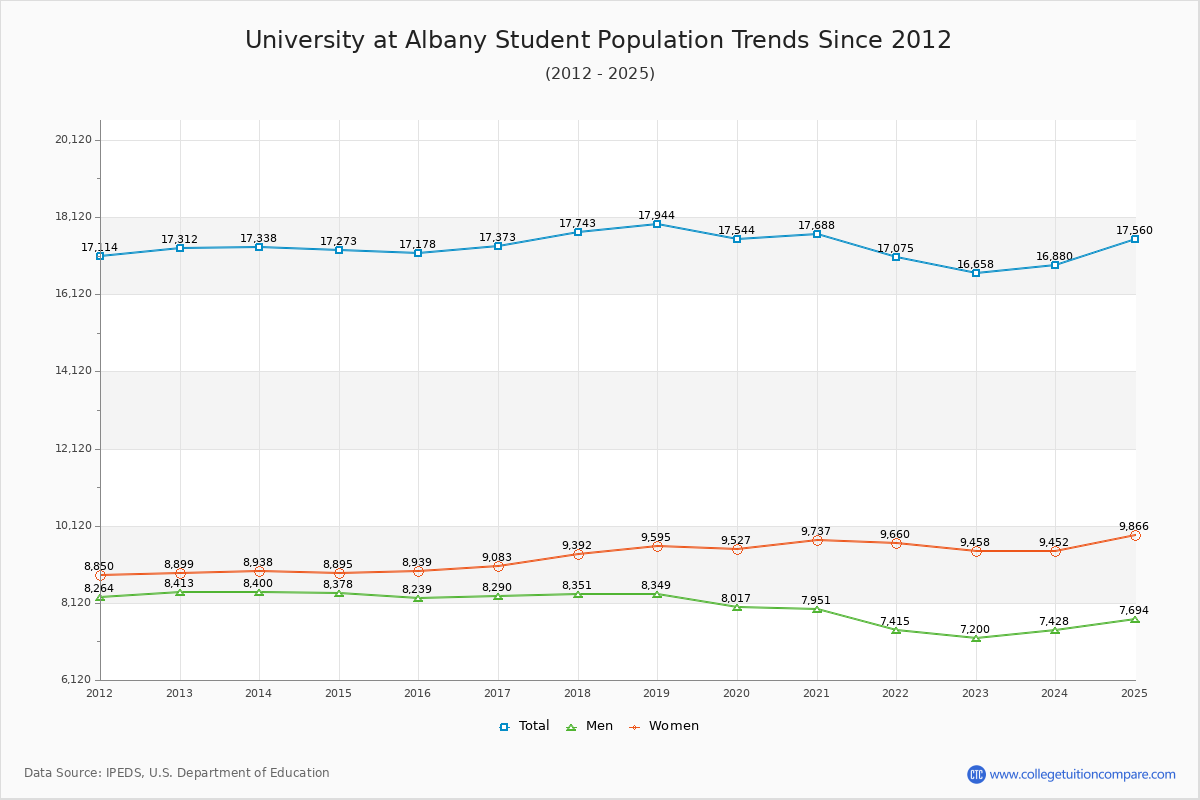
Student Population Changes
The average student population over the last 12 years is 17,375 where 16,658 students are attending the school for the academic year 2022-2023.
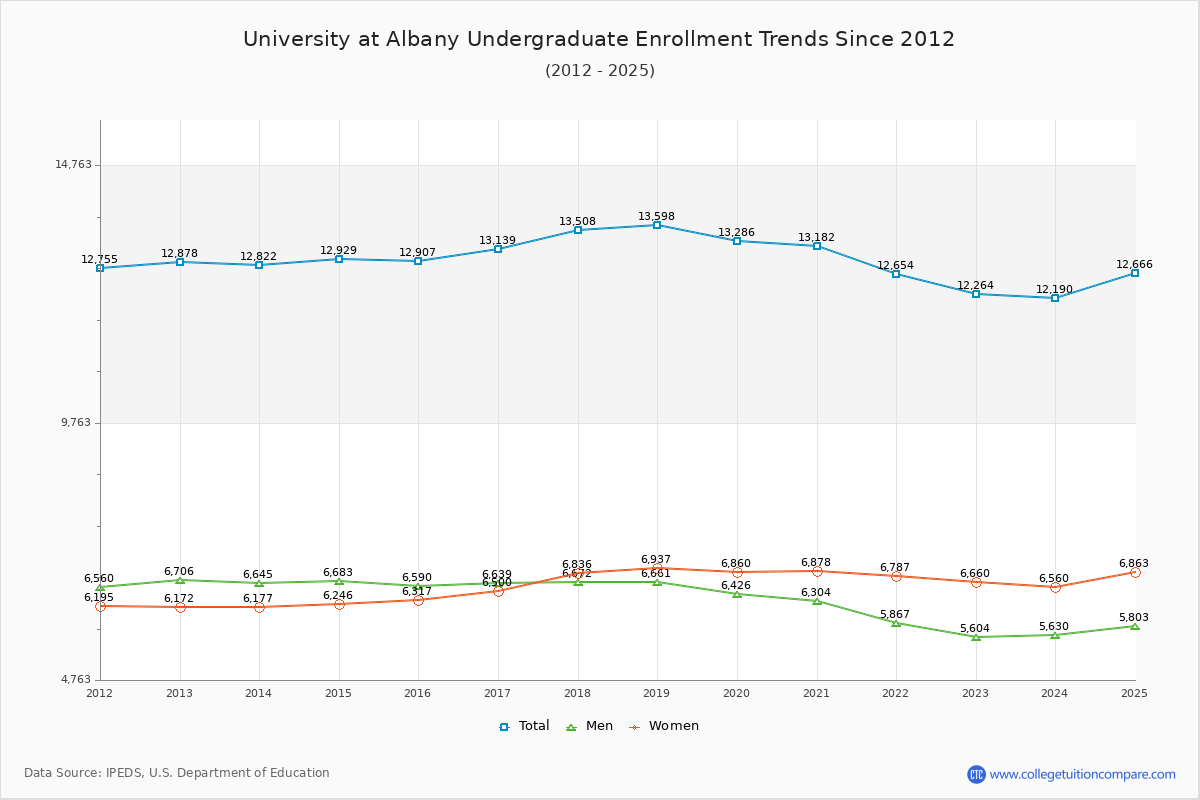
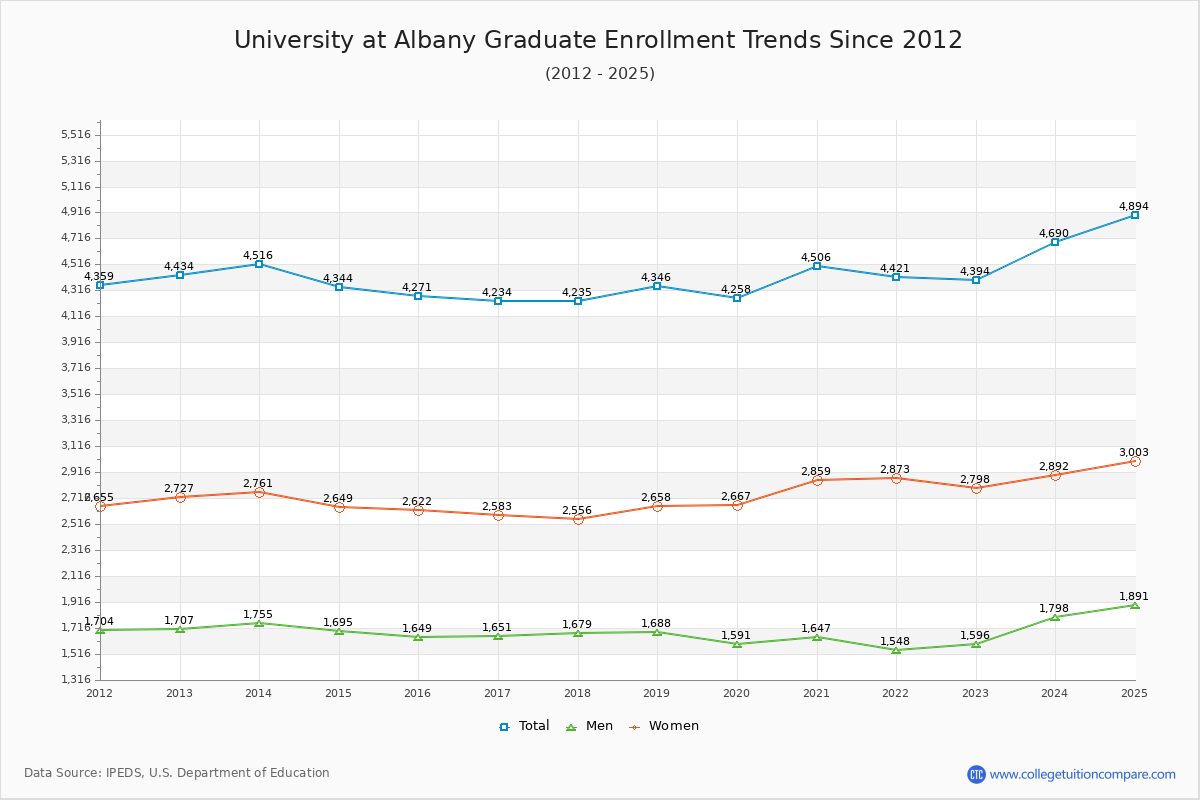
73.62% of total students is undergraduate students and 26.38% students is graduate students. The number of undergraduate students has decreased by 614 and the graduate enrollment has decreased by 40 over past 10 years.
The female to male ratio is 1.31 to 1 and it means that there are more female students enrolled in SUNY Albany than male students.
The following table and chart illustrate the changes in student population by gender at SUNY at Albany since 2012.
| Year | Total | Undergraduate | Graduate | ||||
|---|---|---|---|---|---|---|---|
| Total | Men | Women | Total | Men | Women | ||
| 2012-13 | 17,312 | 12,878 | 6,706 | 6,172 | 4,434 | 1,707 | 2,727 |
| 2013-14 | 17,338 26 | 12,822 -56 | 6,645 -61 | 6,177 5 | 4,516 82 | 1,755 48 | 2,761 34 |
| 2014-15 | 17,273 -65 | 12,929 107 | 6,683 38 | 6,246 69 | 4,344 -172 | 1,695 -60 | 2,649 -112 |
| 2015-16 | 17,178 -95 | 12,907 -22 | 6,590 -93 | 6,317 71 | 4,271 -73 | 1,649 -46 | 2,622 -27 |
| 2016-17 | 17,373 195 | 13,139 232 | 6,639 49 | 6,500 183 | 4,234 -37 | 1,651 2 | 2,583 -39 |
| 2017-18 | 17,743 370 | 13,508 369 | 6,672 33 | 6,836 336 | 4,235 1 | 1,679 28 | 2,556 -27 |
| 2018-19 | 17,944 201 | 13,598 90 | 6,661 -11 | 6,937 101 | 4,346 111 | 1,688 9 | 2,658 102 |
| 2019-20 | 17,544 -400 | 13,286 -312 | 6,426 -235 | 6,860 -77 | 4,258 -88 | 1,591 -97 | 2,667 9 |
| 2020-21 | 17,688 144 | 13,182 -104 | 6,304 -122 | 6,878 18 | 4,506 248 | 1,647 56 | 2,859 192 |
| 2021-22 | 17,075 -613 | 12,654 -528 | 5,867 -437 | 6,787 -91 | 4,421 -85 | 1,548 -99 | 2,873 14 |
| 2022-23 | 16,658 -417 | 12,264 -390 | 5,604 -263 | 6,660 -127 | 4,394 -27 | 1,596 48 | 2,798 -75 |
| Average | 17,375 | 13,015 | 6,436 | 6,579 | 4,360 | 1,655 | 2,705 |