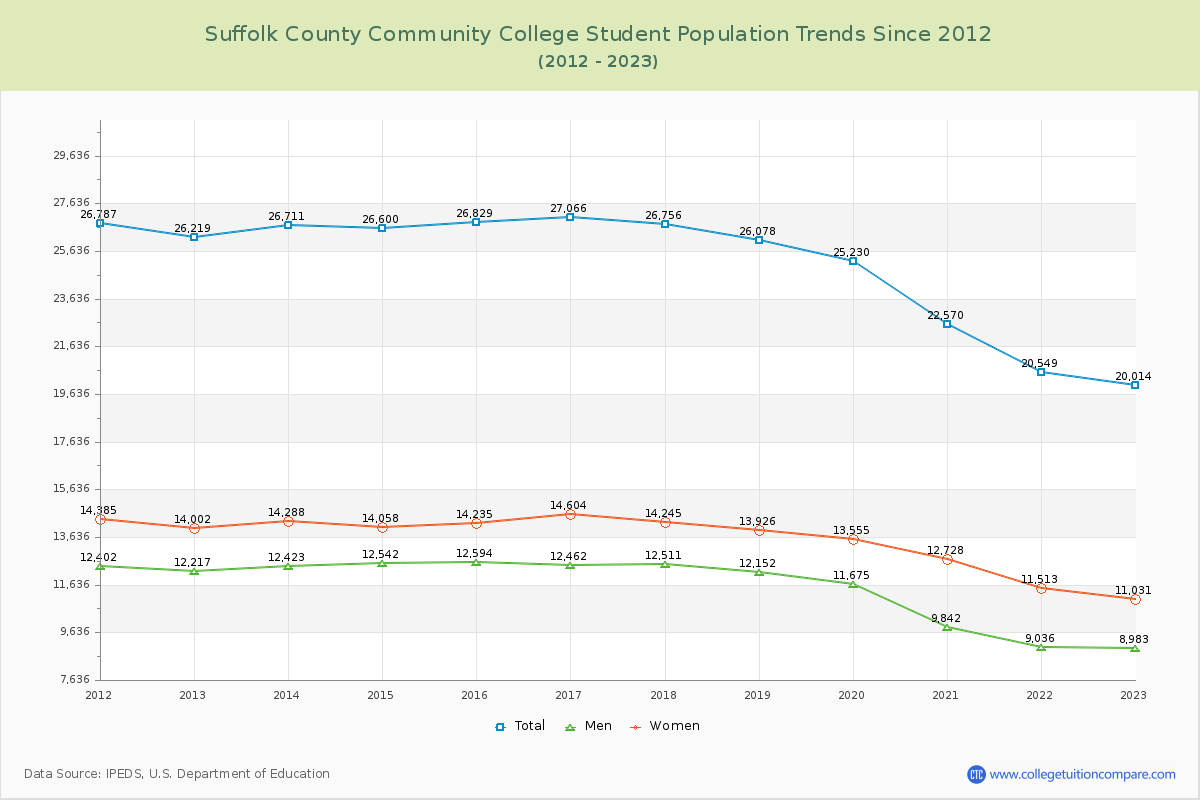
Student Population Changes
The average student population over the last 12 years is 24,966 where 20,014 students are attending the school for the academic year 2022-2023.
The female to male ratio is 1.23 to 1 and it means that there are slightly more female students enrolled in Suffolk County CC than male students.
The following table and chart illustrate the changes in student population by gender at Suffolk County Community College since 2012.
| Year | Total | Men | Women |
|---|---|---|---|
| 2012-13 | 26,219 | 12,217 | 14,002 |
| 2013-14 | 26,711 492 | 12,423 206 | 14,288 286 |
| 2014-15 | 26,600 -111 | 12,542 119 | 14,058 -230 |
| 2015-16 | 26,829 229 | 12,594 52 | 14,235 177 |
| 2016-17 | 27,066 237 | 12,462 -132 | 14,604 369 |
| 2017-18 | 26,756 -310 | 12,511 49 | 14,245 -359 |
| 2018-19 | 26,078 -678 | 12,152 -359 | 13,926 -319 |
| 2019-20 | 25,230 -848 | 11,675 -477 | 13,555 -371 |
| 2020-21 | 22,570 -2,660 | 9,842 -1,833 | 12,728 -827 |
| 2021-22 | 20,549 -2,021 | 9,036 -806 | 11,513 -1,215 |
| 2022-23 | 20,014 -535 | 8,983 -53 | 11,031 -482 |
| Average | 24,966 | 11,494 | 13,471 |