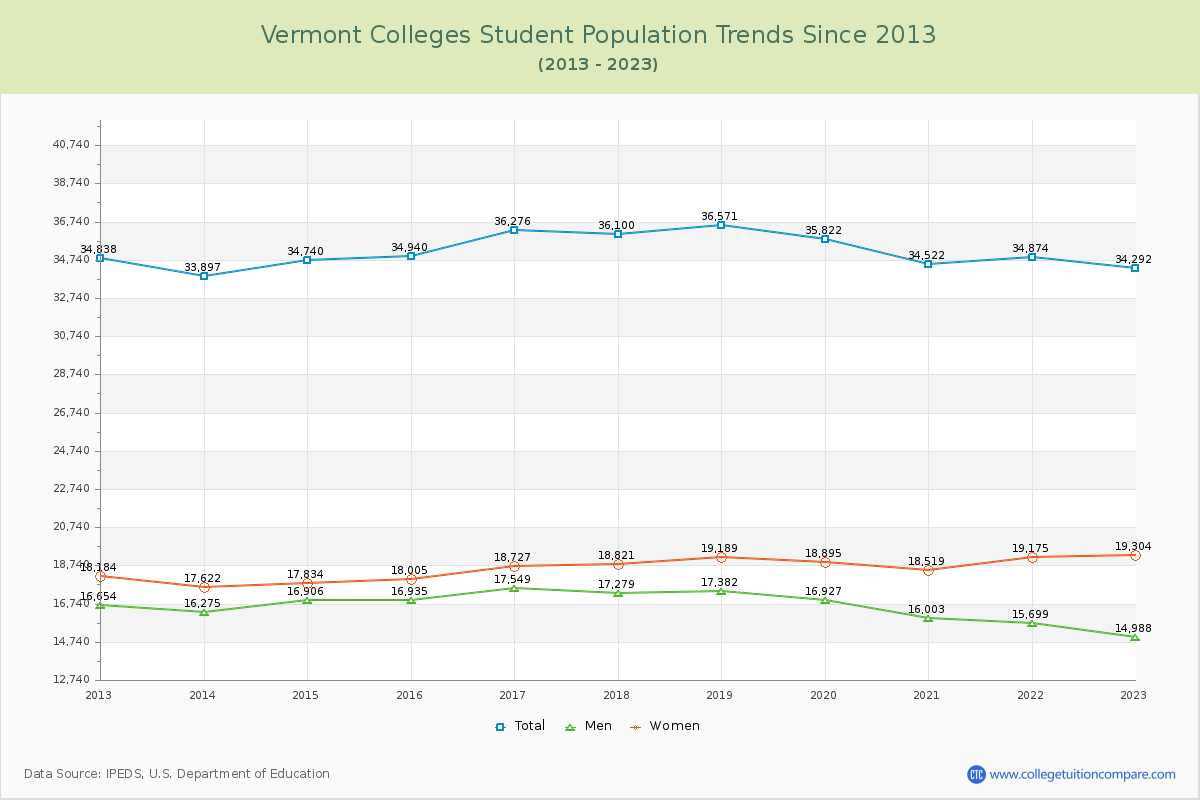
Student Population Changes
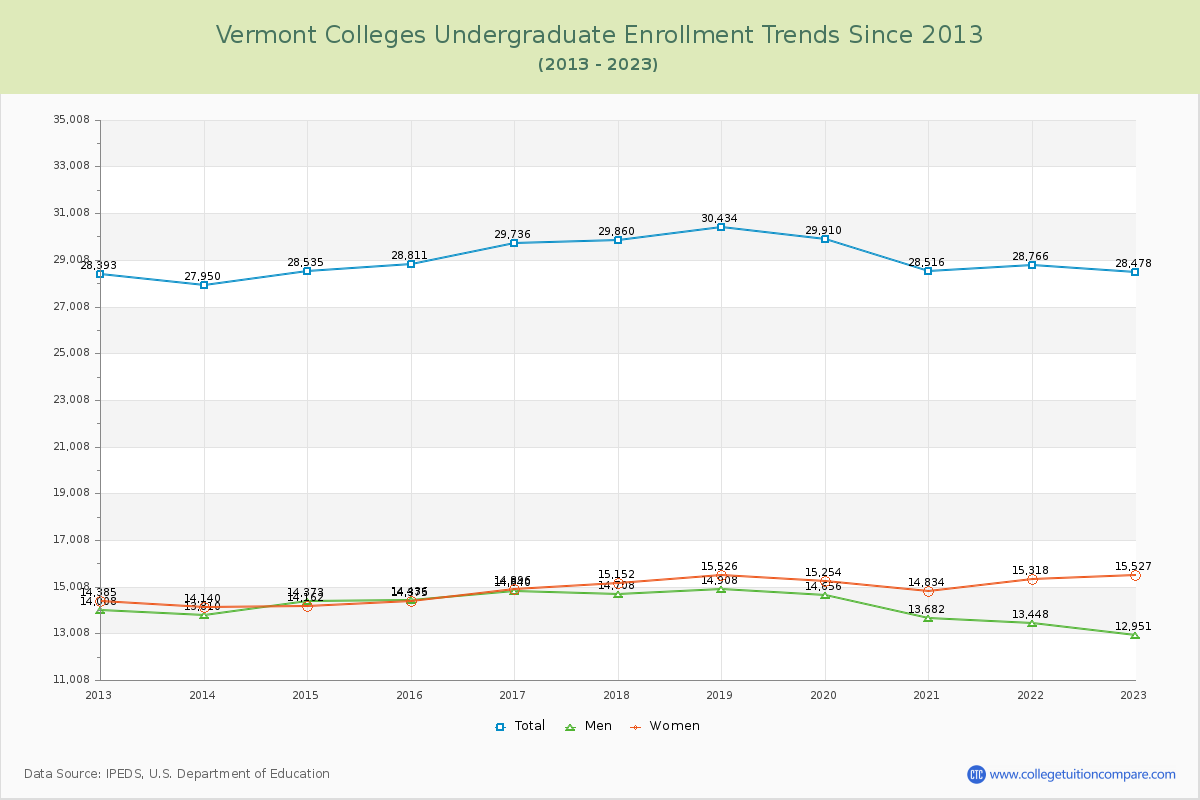
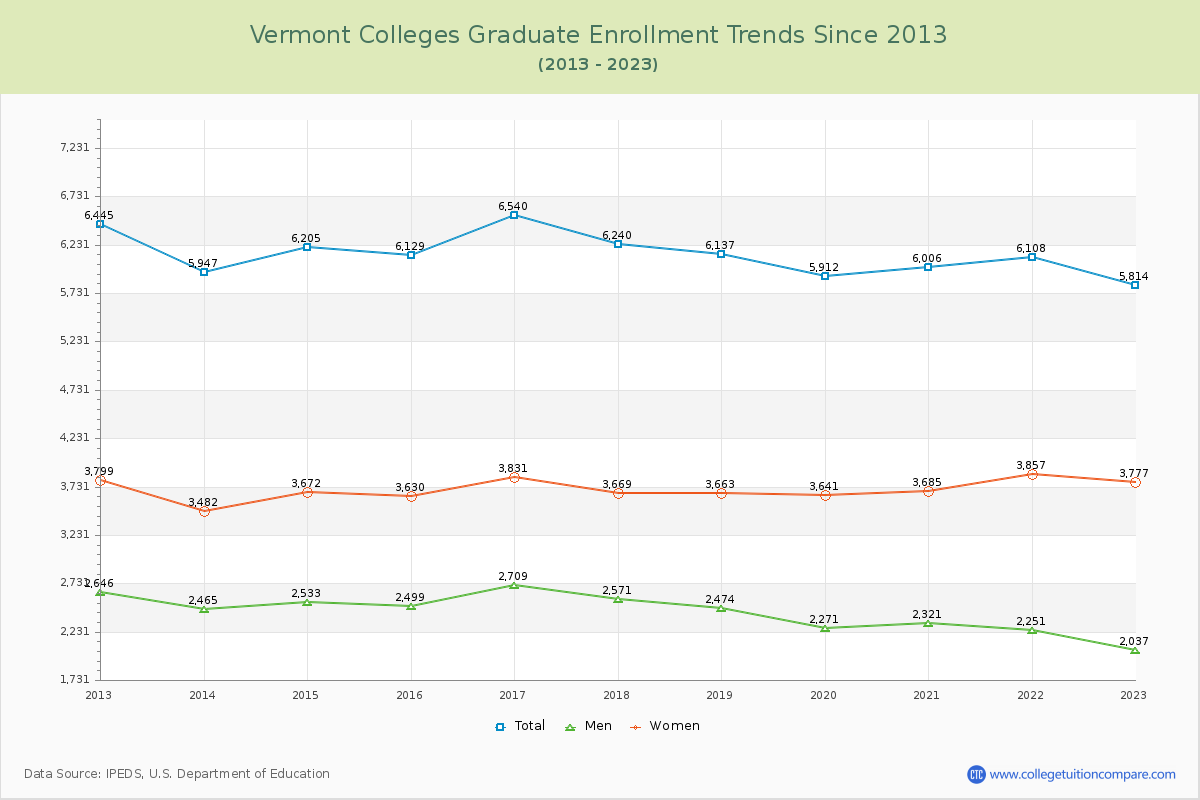
The average number of students over the past 11 years is 35,170, and 34,292 students were attending the schools in the academic year 2022-2023. Of the total students, 83.05% are undergraduate students and 16.95% are graduate students. Over the past 11, the number of undergraduate students increased by 85, and the graduate student enrollment decreased by 631.
The female to male ratio is 1.29 to 1, meaning that there are slightly more female students enrolled in Vermont Colleges than male students.
The following table and chart illustrate the changes in student population by gender at Vermont Colleges since 2013.
| Year | Total | Undergraduate | Graduate | ||||
|---|---|---|---|---|---|---|---|
| Total | Men | Women | Total | Men | Women | ||
| 2012-13 | 34,838 | 28,393 | 14,008 | 14,385 | 6,445 | 2,646 | 3,799 |
| 2013-14 | 33,897 -941 | 27,950 -443 | 13,810 -198 | 14,140 -245 | 5,947 -498 | 2,465 -181 | 3,482 -317 |
| 2014-15 | 34,740 843 | 28,535 585 | 14,373 563 | 14,162 22 | 6,205 258 | 2,533 68 | 3,672 190 |
| 2015-16 | 34,940 200 | 28,811 276 | 14,436 63 | 14,375 213 | 6,129 -76 | 2,499 -34 | 3,630 -42 |
| 2016-17 | 36,276 1,336 | 29,736 925 | 14,840 404 | 14,896 521 | 6,540 411 | 2,709 210 | 3,831 201 |
| 2017-18 | 36,100 -176 | 29,860 124 | 14,708 -132 | 15,152 256 | 6,240 -300 | 2,571 -138 | 3,669 -162 |
| 2018-19 | 36,571 471 | 30,434 574 | 14,908 200 | 15,526 374 | 6,137 -103 | 2,474 -97 | 3,663 -6 |
| 2019-20 | 35,822 -749 | 29,910 -524 | 14,656 -252 | 15,254 -272 | 5,912 -225 | 2,271 -203 | 3,641 -22 |
| 2020-21 | 34,522 -1,300 | 28,516 -1,394 | 13,682 -974 | 14,834 -420 | 6,006 94 | 2,321 50 | 3,685 44 |
| 2021-22 | 34,874 352 | 28,766 250 | 13,448 -234 | 15,318 484 | 6,108 102 | 2,251 -70 | 3,857 172 |
| 2022-23 | 34,292 -582 | 28,478 -288 | 12,951 -497 | 15,527 209 | 5,814 -294 | 2,037 -214 | 3,777 -80 |
| Average | 35,170 | 29,035 | 14,165 | 14,870 | 6,135 | 2,434 | 3,701 |