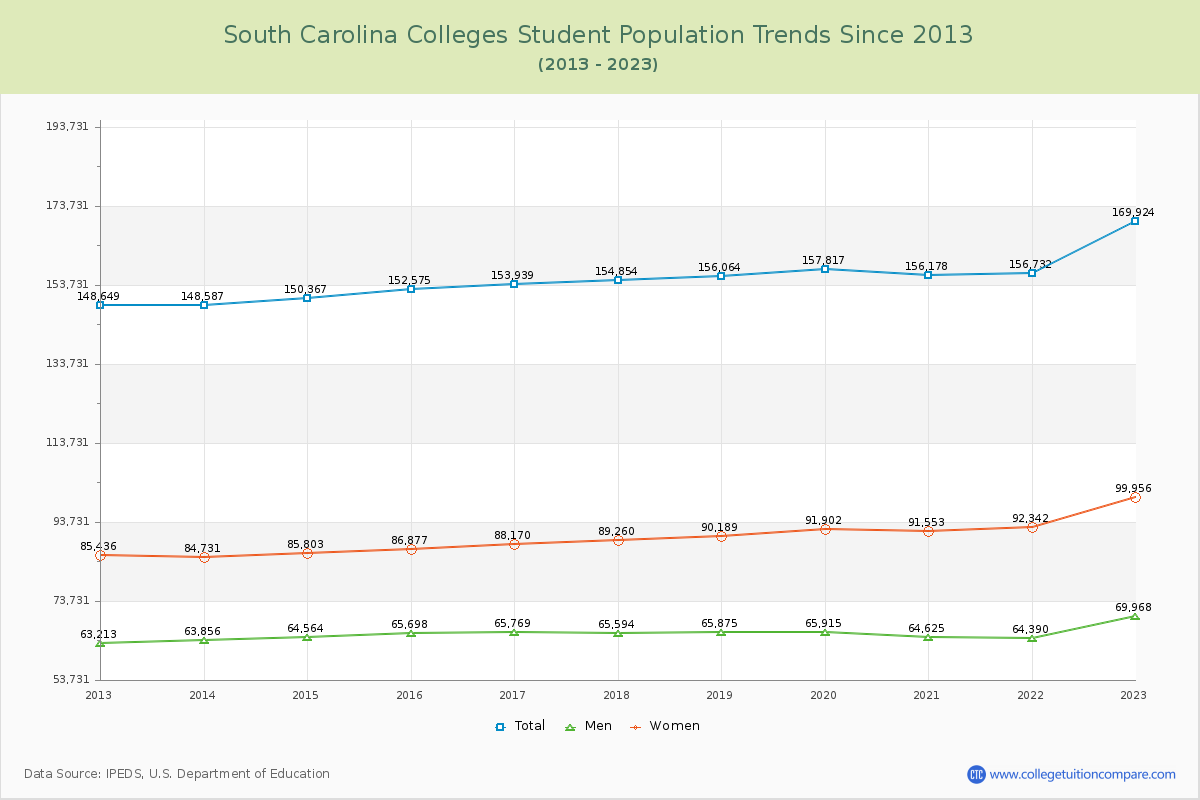
Student Population Changes
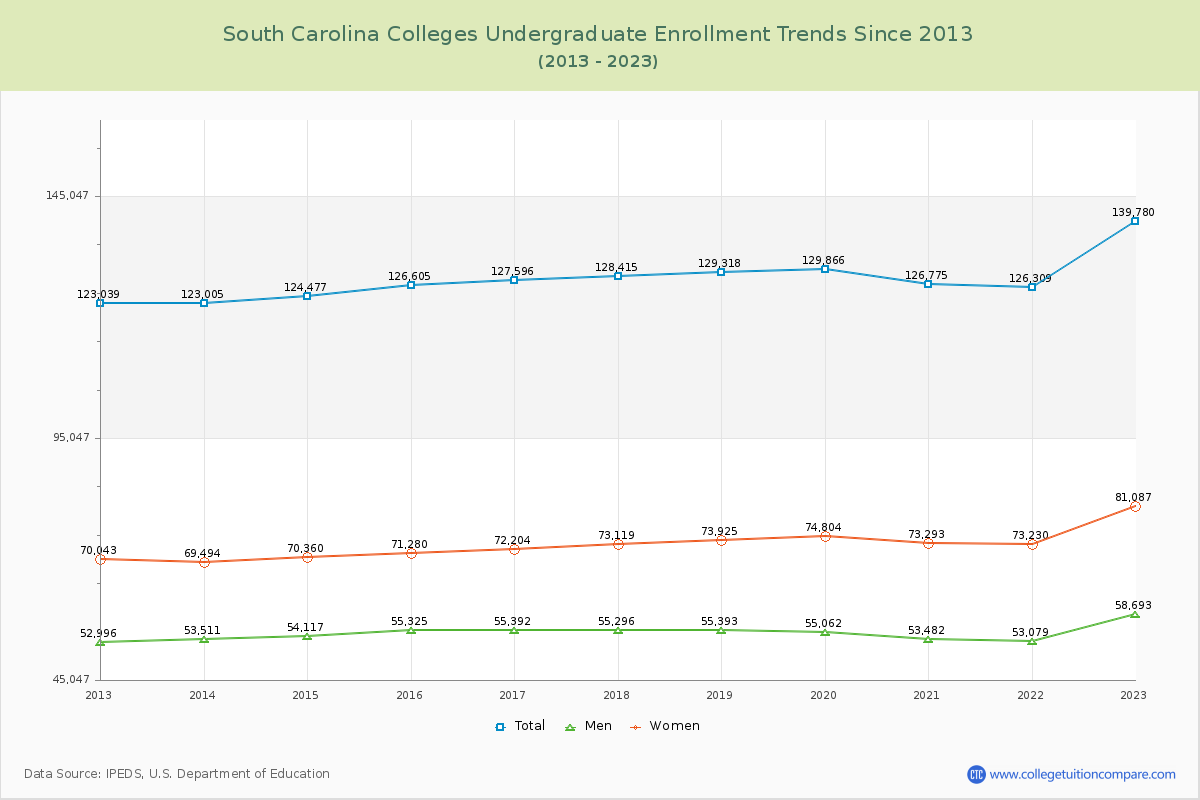
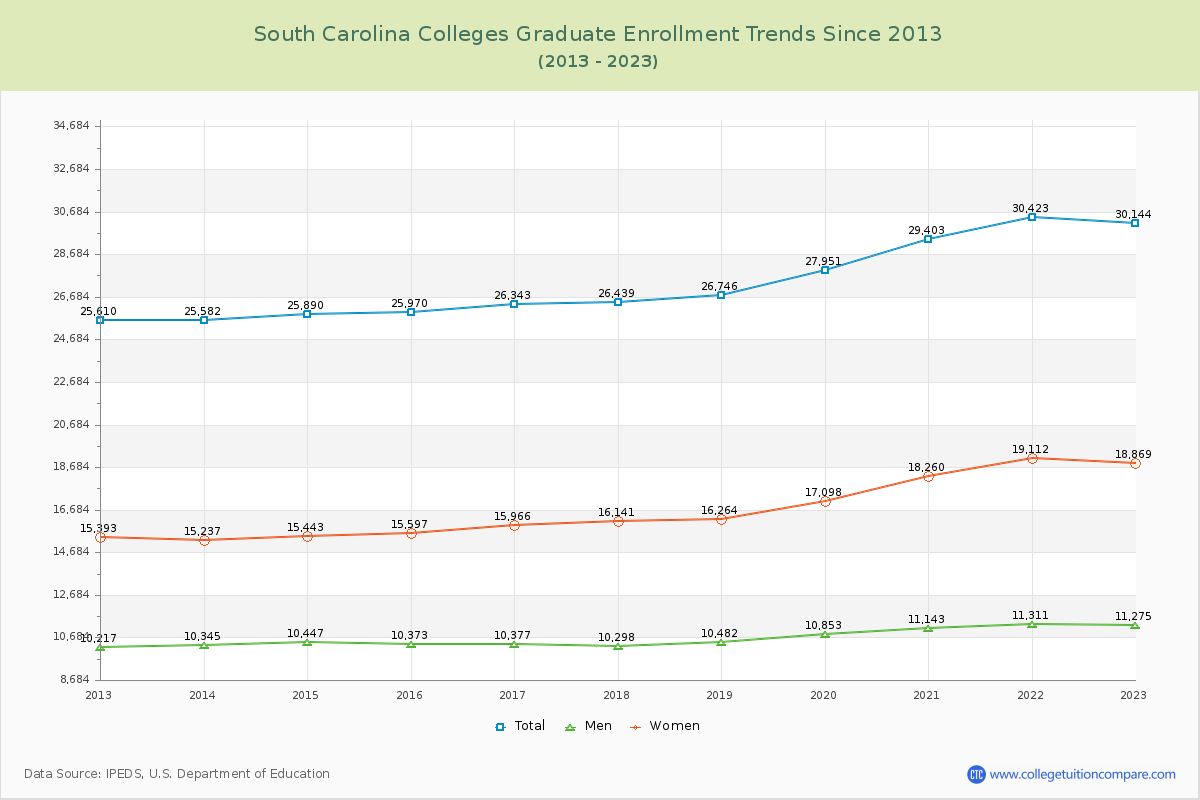
The average number of students over the past 11 years is 155,062, and 169,924 students were attending the schools in the academic year 2022-2023. Of the total students, 82.26% are undergraduate students and 17.74% are graduate students. Over the past 11, the number of undergraduate students increased by 16,741, and the graduate student enrollment increased by 4,534.
The female to male ratio is 1.43 to 1, meaning that there are more female students enrolled in South Carolina Colleges than male students.
The following table and chart illustrate the changes in student population by gender at South Carolina Colleges since 2013.
| Year | Total | Undergraduate | Graduate | ||||
|---|---|---|---|---|---|---|---|
| Total | Men | Women | Total | Men | Women | ||
| 2012-13 | 148,649 | 123,039 | 52,996 | 70,043 | 25,610 | 10,217 | 15,393 |
| 2013-14 | 148,587 -62 | 123,005 -34 | 53,511 515 | 69,494 -549 | 25,582 -28 | 10,345 128 | 15,237 -156 |
| 2014-15 | 150,367 1,780 | 124,477 1,472 | 54,117 606 | 70,360 866 | 25,890 308 | 10,447 102 | 15,443 206 |
| 2015-16 | 152,575 2,208 | 126,605 2,128 | 55,325 1,208 | 71,280 920 | 25,970 80 | 10,373 -74 | 15,597 154 |
| 2016-17 | 153,939 1,364 | 127,596 991 | 55,392 67 | 72,204 924 | 26,343 373 | 10,377 4 | 15,966 369 |
| 2017-18 | 154,854 915 | 128,415 819 | 55,296 -96 | 73,119 915 | 26,439 96 | 10,298 -79 | 16,141 175 |
| 2018-19 | 156,064 1,210 | 129,318 903 | 55,393 97 | 73,925 806 | 26,746 307 | 10,482 184 | 16,264 123 |
| 2019-20 | 157,817 1,753 | 129,866 548 | 55,062 -331 | 74,804 879 | 27,951 1,205 | 10,853 371 | 17,098 834 |
| 2020-21 | 156,178 -1,639 | 126,775 -3,091 | 53,482 -1,580 | 73,293 -1,511 | 29,403 1,452 | 11,143 290 | 18,260 1,162 |
| 2021-22 | 156,732 554 | 126,309 -466 | 53,079 -403 | 73,230 -63 | 30,423 1,020 | 11,311 168 | 19,112 852 |
| 2022-23 | 169,924 13,192 | 139,780 13,471 | 58,693 5,614 | 81,087 7,857 | 30,144 -279 | 11,275 -36 | 18,869 -243 |
| Average | 155,062 | 127,744 | 54,759 | 72,985 | 27,318 | 10,647 | 16,671 |