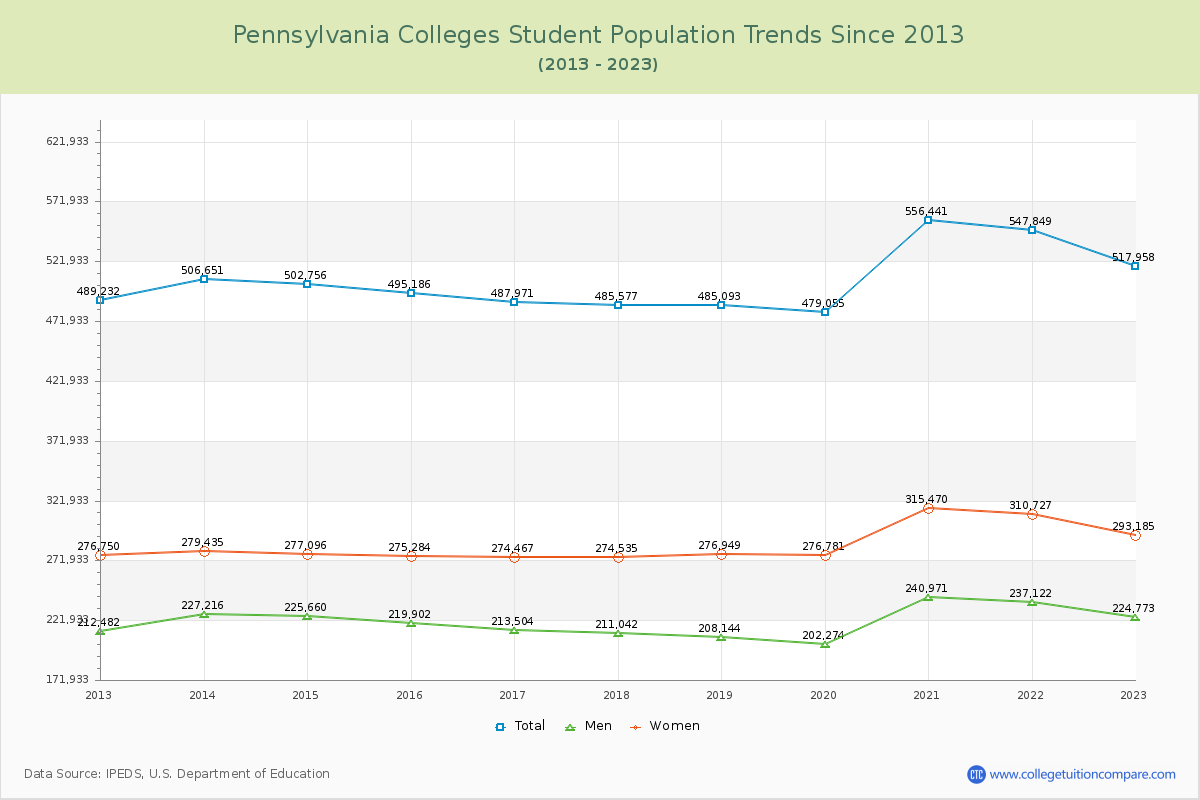
Student Population Changes
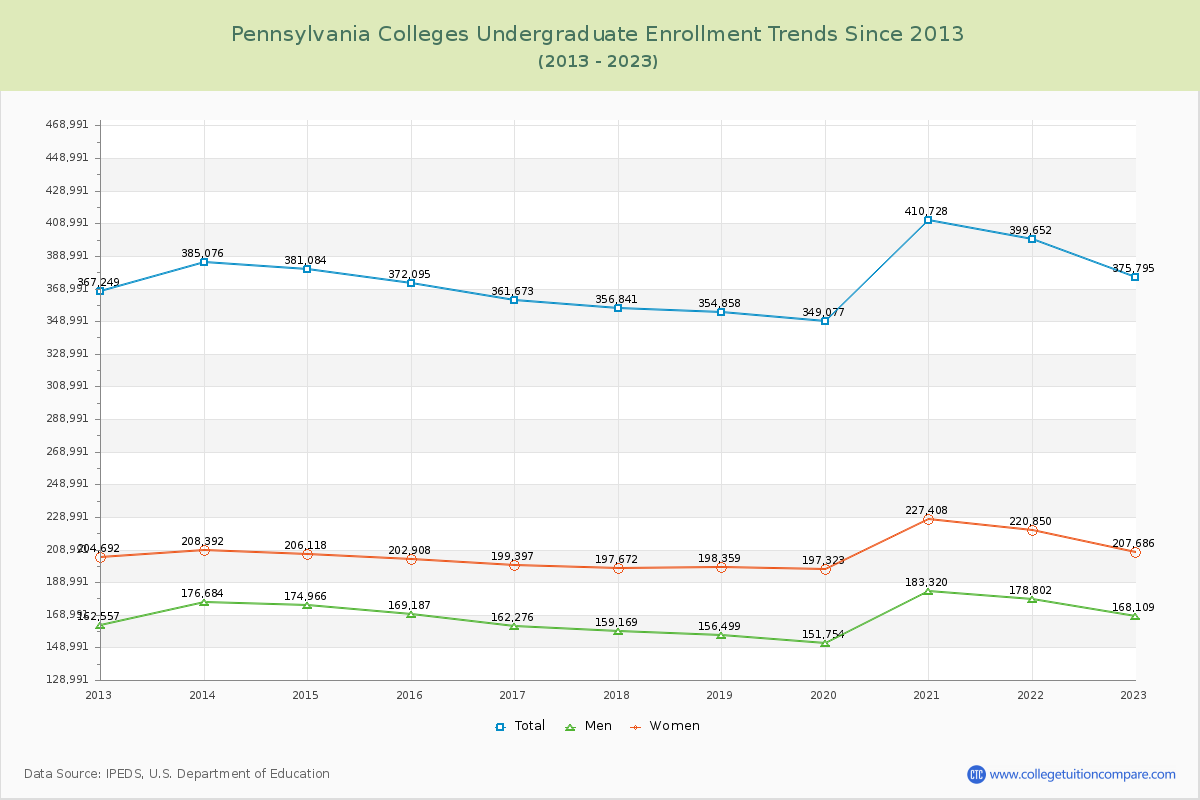
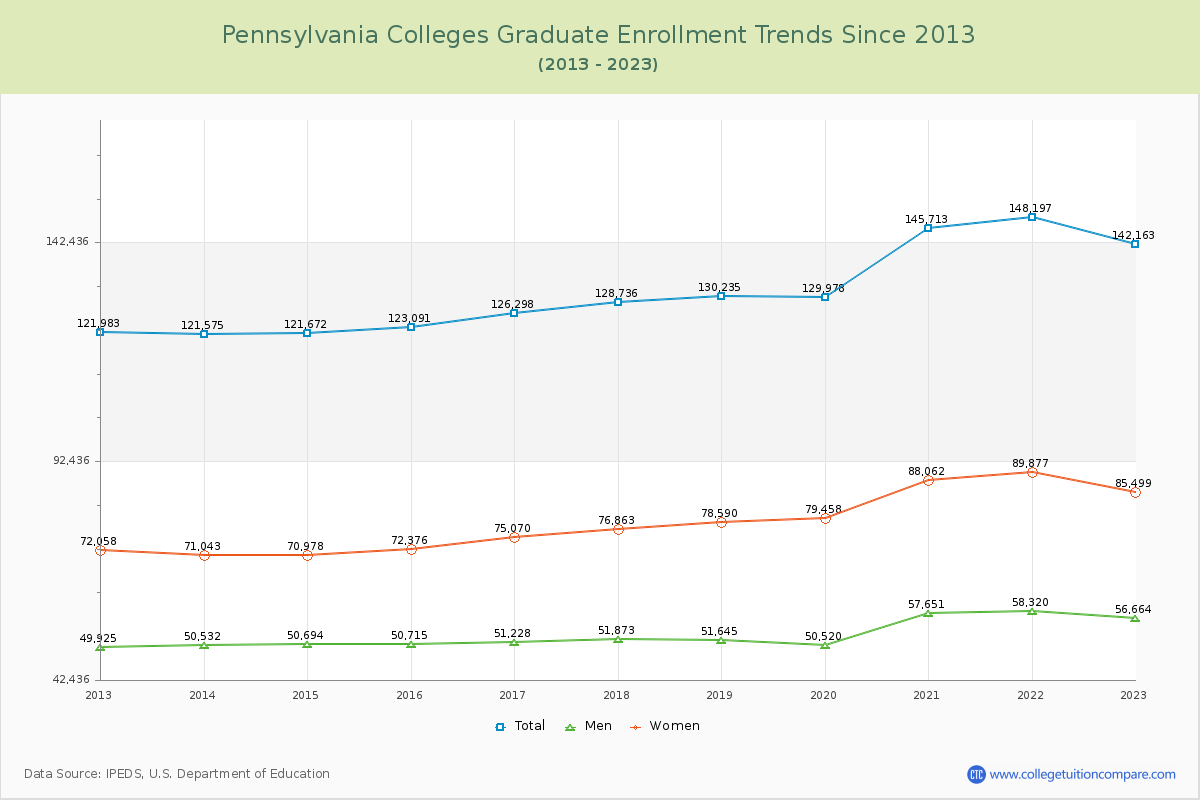
The average number of students over the past 11 years is 504,888, and 517,958 students were attending the schools in the academic year 2022-2023. Of the total students, 72.57% are undergraduate students and 27.43% are graduate students. Over the past 11, the number of undergraduate students increased by 18,021, and the graduate student enrollment increased by 23,660.
The female to male ratio is 1.31 to 1, meaning that there are more female students enrolled in Pennsylvania Colleges than male students.
The following table and chart illustrate the changes in student population by gender at Pennsylvania Colleges since 2013.
| Year | Total | Undergraduate | Graduate | ||||
|---|---|---|---|---|---|---|---|
| Total | Men | Women | Total | Men | Women | ||
| 2012-13 | 489,232 | 367,249 | 162,557 | 204,692 | 121,983 | 49,925 | 72,058 |
| 2013-14 | 506,651 17,419 | 385,076 17,827 | 176,684 14,127 | 208,392 3,700 | 121,575 -408 | 50,532 607 | 71,043 -1,015 |
| 2014-15 | 502,756 -3,895 | 381,084 -3,992 | 174,966 -1,718 | 206,118 -2,274 | 121,672 97 | 50,694 162 | 70,978 -65 |
| 2015-16 | 495,186 -7,570 | 372,095 -8,989 | 169,187 -5,779 | 202,908 -3,210 | 123,091 1,419 | 50,715 21 | 72,376 1,398 |
| 2016-17 | 487,971 -7,215 | 361,673 -10,422 | 162,276 -6,911 | 199,397 -3,511 | 126,298 3,207 | 51,228 513 | 75,070 2,694 |
| 2017-18 | 485,577 -2,394 | 356,841 -4,832 | 159,169 -3,107 | 197,672 -1,725 | 128,736 2,438 | 51,873 645 | 76,863 1,793 |
| 2018-19 | 485,093 -484 | 354,858 -1,983 | 156,499 -2,670 | 198,359 687 | 130,235 1,499 | 51,645 -228 | 78,590 1,727 |
| 2019-20 | 479,055 -6,038 | 349,077 -5,781 | 151,754 -4,745 | 197,323 -1,036 | 129,978 -257 | 50,520 -1,125 | 79,458 868 |
| 2020-21 | 556,441 77,386 | 410,728 61,651 | 183,320 31,566 | 227,408 30,085 | 145,713 15,735 | 57,651 7,131 | 88,062 8,604 |
| 2021-22 | 547,849 -8,592 | 399,652 -11,076 | 178,802 -4,518 | 220,850 -6,558 | 148,197 2,484 | 58,320 669 | 89,877 1,815 |
| 2022-23 | 517,958 -29,891 | 375,795 -23,857 | 168,109 -10,693 | 207,686 -13,164 | 142,163 -6,034 | 56,664 -1,656 | 85,499 -4,378 |
| Average | 504,888 | 374,012 | 167,575 | 206,437 | 130,876 | 52,706 | 78,170 |