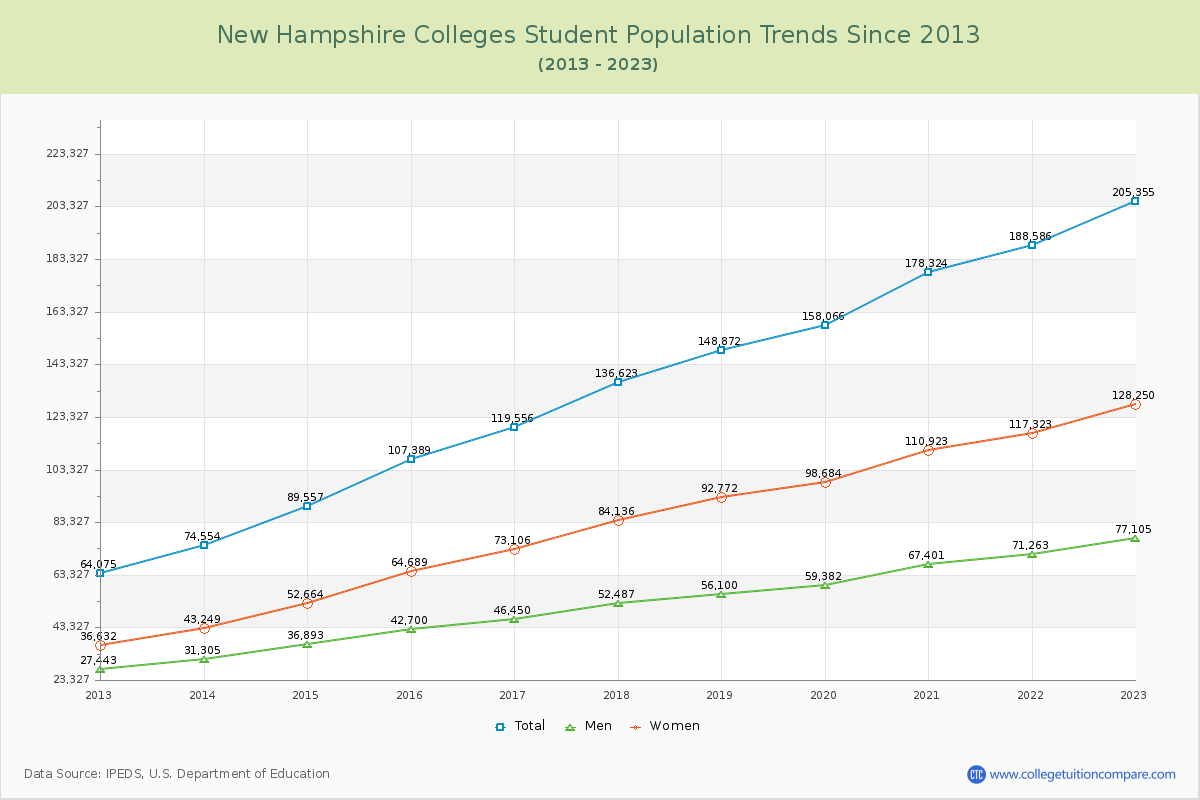
Student Population Changes
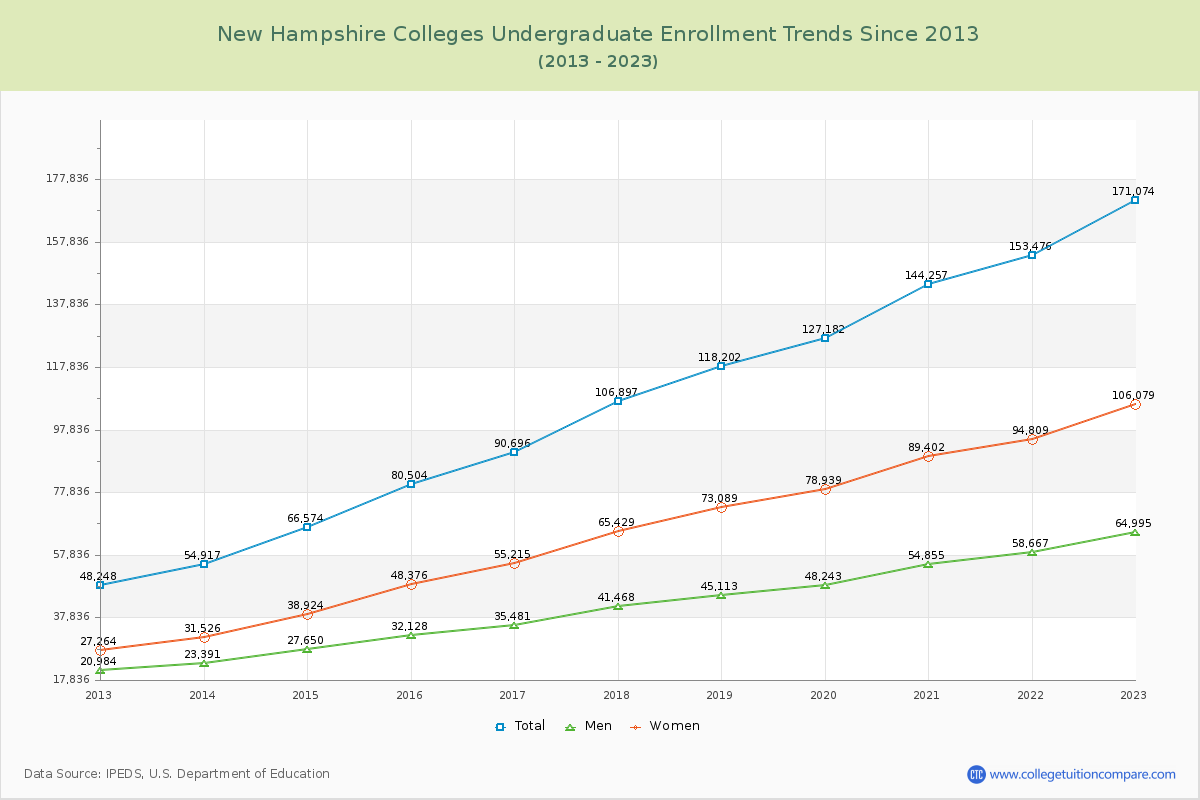
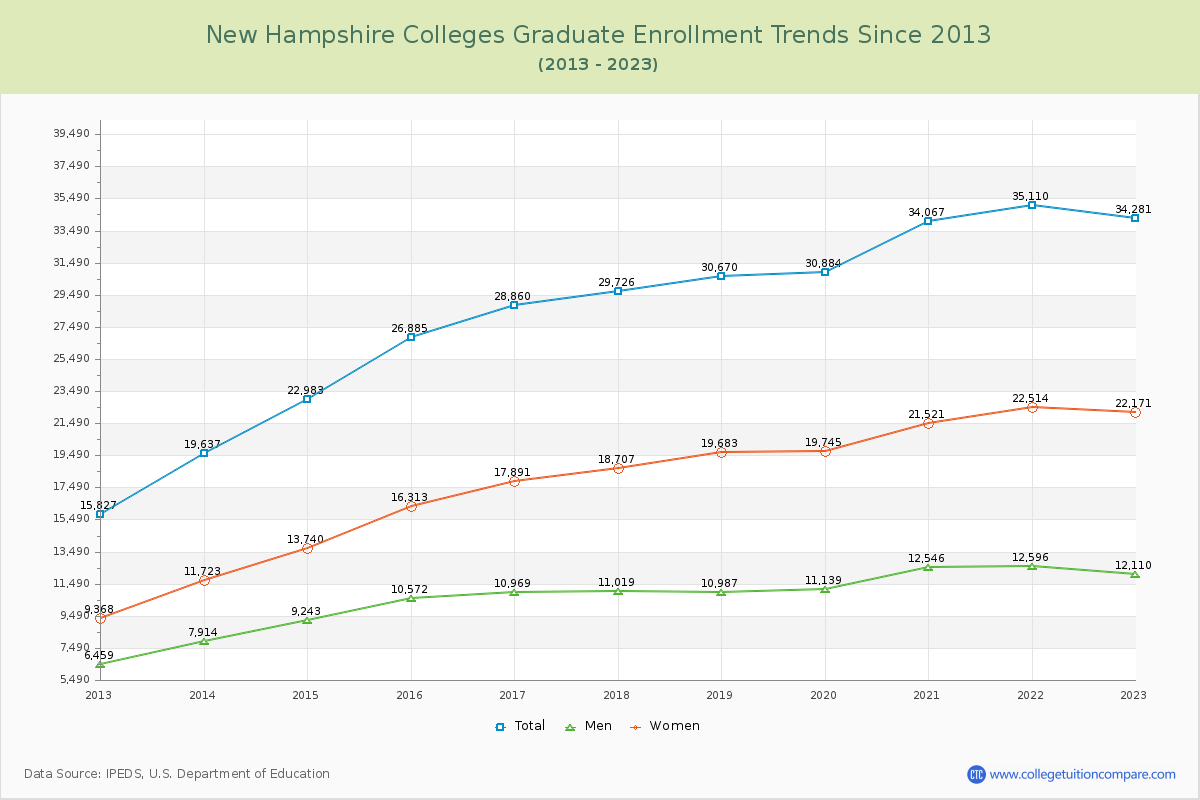
The average number of students over the past 11 years is 133,723, and 205,355 students were attending the schools in the academic year 2022-2023. Of the total students, 83.31% are undergraduate students and 16.69% are graduate students. Over the past 11, the number of undergraduate students increased by 122,826, and the graduate student enrollment increased by 18,454.
The female to male ratio is 1.66 to 1, meaning that there are more female students enrolled in New Hampshire Colleges than male students.
The following table and chart illustrate the changes in student population by gender at New Hampshire Colleges since 2013.
| Year | Total | Undergraduate | Graduate | ||||
|---|---|---|---|---|---|---|---|
| Total | Men | Women | Total | Men | Women | ||
| 2012-13 | 64,075 | 48,248 | 20,984 | 27,264 | 15,827 | 6,459 | 9,368 |
| 2013-14 | 74,554 10,479 | 54,917 6,669 | 23,391 2,407 | 31,526 4,262 | 19,637 3,810 | 7,914 1,455 | 11,723 2,355 |
| 2014-15 | 89,557 15,003 | 66,574 11,657 | 27,650 4,259 | 38,924 7,398 | 22,983 3,346 | 9,243 1,329 | 13,740 2,017 |
| 2015-16 | 107,389 17,832 | 80,504 13,930 | 32,128 4,478 | 48,376 9,452 | 26,885 3,902 | 10,572 1,329 | 16,313 2,573 |
| 2016-17 | 119,556 12,167 | 90,696 10,192 | 35,481 3,353 | 55,215 6,839 | 28,860 1,975 | 10,969 397 | 17,891 1,578 |
| 2017-18 | 136,623 17,067 | 106,897 16,201 | 41,468 5,987 | 65,429 10,214 | 29,726 866 | 11,019 50 | 18,707 816 |
| 2018-19 | 148,872 12,249 | 118,202 11,305 | 45,113 3,645 | 73,089 7,660 | 30,670 944 | 10,987 -32 | 19,683 976 |
| 2019-20 | 158,066 9,194 | 127,182 8,980 | 48,243 3,130 | 78,939 5,850 | 30,884 214 | 11,139 152 | 19,745 62 |
| 2020-21 | 178,324 20,258 | 144,257 17,075 | 54,855 6,612 | 89,402 10,463 | 34,067 3,183 | 12,546 1,407 | 21,521 1,776 |
| 2021-22 | 188,586 10,262 | 153,476 9,219 | 58,667 3,812 | 94,809 5,407 | 35,110 1,043 | 12,596 50 | 22,514 993 |
| 2022-23 | 205,355 16,769 | 171,074 17,598 | 64,995 6,328 | 106,079 11,270 | 34,281 -829 | 12,110 -486 | 22,171 -343 |
| Average | 133,723 | 105,639 | 41,180 | 64,459 | 28,085 | 10,505 | 17,580 |