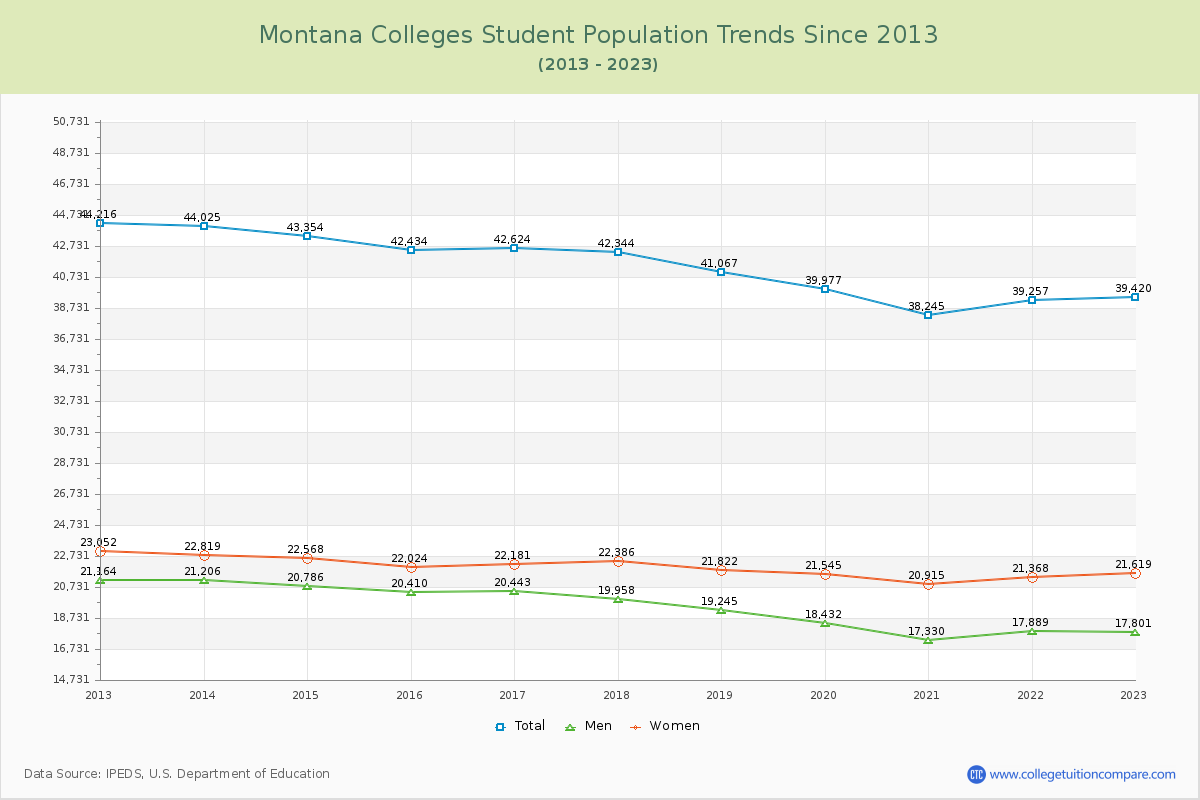
Student Population Changes
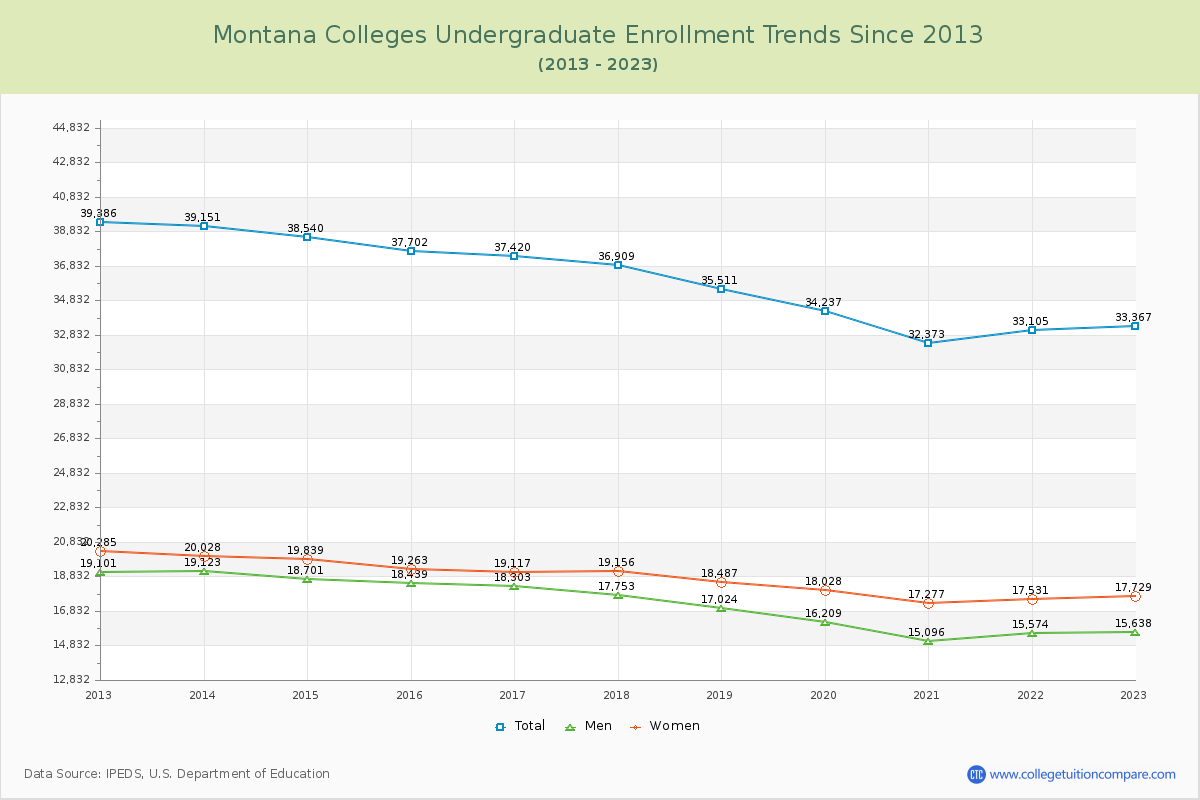
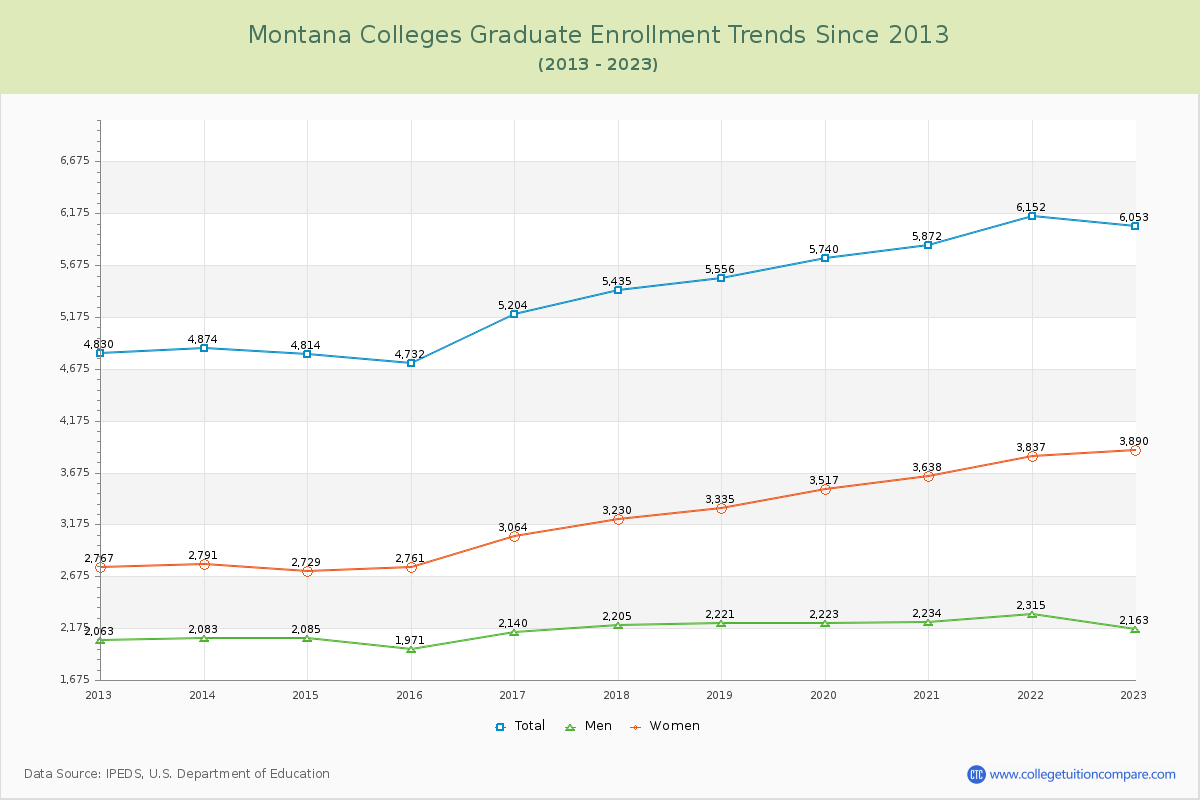
The average number of students over the past 11 years is 41,542, and 39,420 students were attending the schools in the academic year 2022-2023. Of the total students, 84.64% are undergraduate students and 15.36% are graduate students. Over the past 11, the number of undergraduate students decreased by 6,019, and the graduate student enrollment increased by 1,223.
The female to male ratio is 1.21 to 1, meaning that there are slightly more female students enrolled in Montana Colleges than male students.
The following table and chart illustrate the changes in student population by gender at Montana Colleges since 2013.
| Year | Total | Undergraduate | Graduate | ||||
|---|---|---|---|---|---|---|---|
| Total | Men | Women | Total | Men | Women | ||
| 2012-13 | 44,216 | 39,386 | 19,101 | 20,285 | 4,830 | 2,063 | 2,767 |
| 2013-14 | 44,025 -191 | 39,151 -235 | 19,123 22 | 20,028 -257 | 4,874 44 | 2,083 20 | 2,791 24 |
| 2014-15 | 43,354 -671 | 38,540 -611 | 18,701 -422 | 19,839 -189 | 4,814 -60 | 2,085 2 | 2,729 -62 |
| 2015-16 | 42,434 -920 | 37,702 -838 | 18,439 -262 | 19,263 -576 | 4,732 -82 | 1,971 -114 | 2,761 32 |
| 2016-17 | 42,624 190 | 37,420 -282 | 18,303 -136 | 19,117 -146 | 5,204 472 | 2,140 169 | 3,064 303 |
| 2017-18 | 42,344 -280 | 36,909 -511 | 17,753 -550 | 19,156 39 | 5,435 231 | 2,205 65 | 3,230 166 |
| 2018-19 | 41,067 -1,277 | 35,511 -1,398 | 17,024 -729 | 18,487 -669 | 5,556 121 | 2,221 16 | 3,335 105 |
| 2019-20 | 39,977 -1,090 | 34,237 -1,274 | 16,209 -815 | 18,028 -459 | 5,740 184 | 2,223 2 | 3,517 182 |
| 2020-21 | 38,245 -1,732 | 32,373 -1,864 | 15,096 -1,113 | 17,277 -751 | 5,872 132 | 2,234 11 | 3,638 121 |
| 2021-22 | 39,257 1,012 | 33,105 732 | 15,574 478 | 17,531 254 | 6,152 280 | 2,315 81 | 3,837 199 |
| 2022-23 | 39,420 163 | 33,367 262 | 15,638 64 | 17,729 198 | 6,053 -99 | 2,163 -152 | 3,890 53 |
| Average | 41,542 | 36,155 | 17,360 | 18,795 | 5,387 | 2,155 | 3,233 |