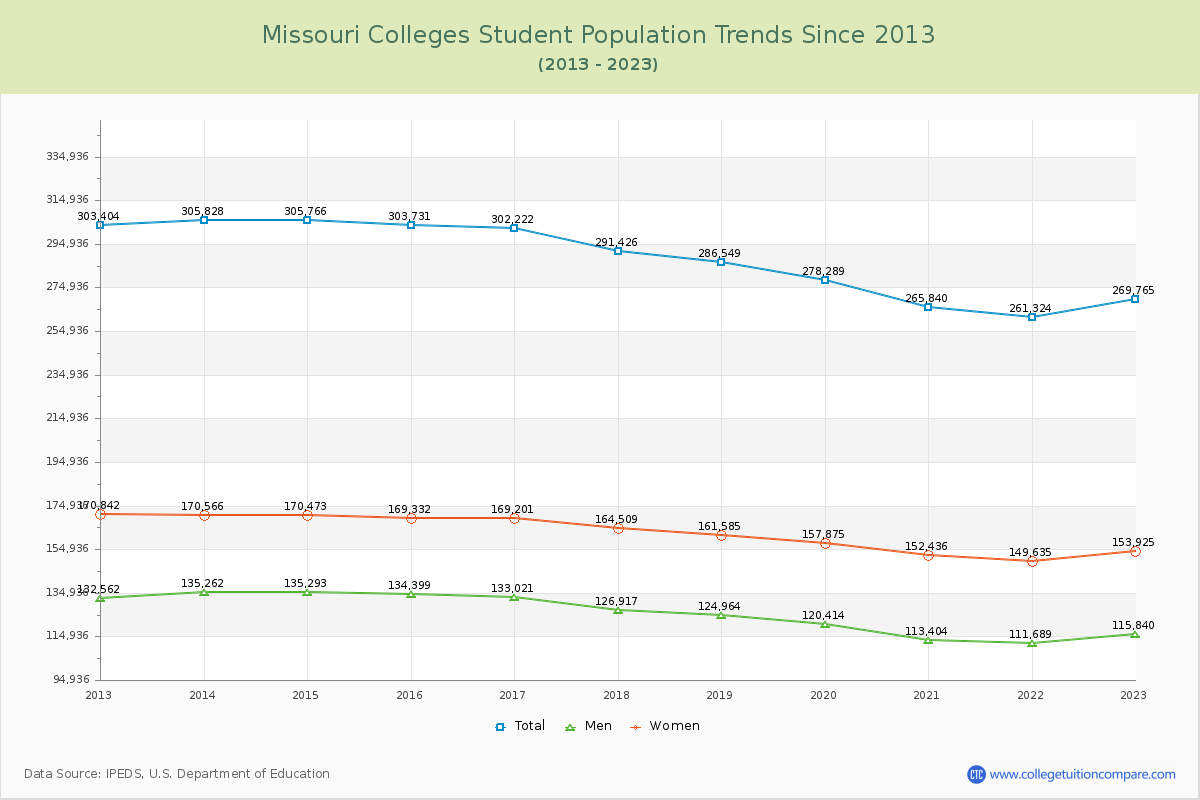
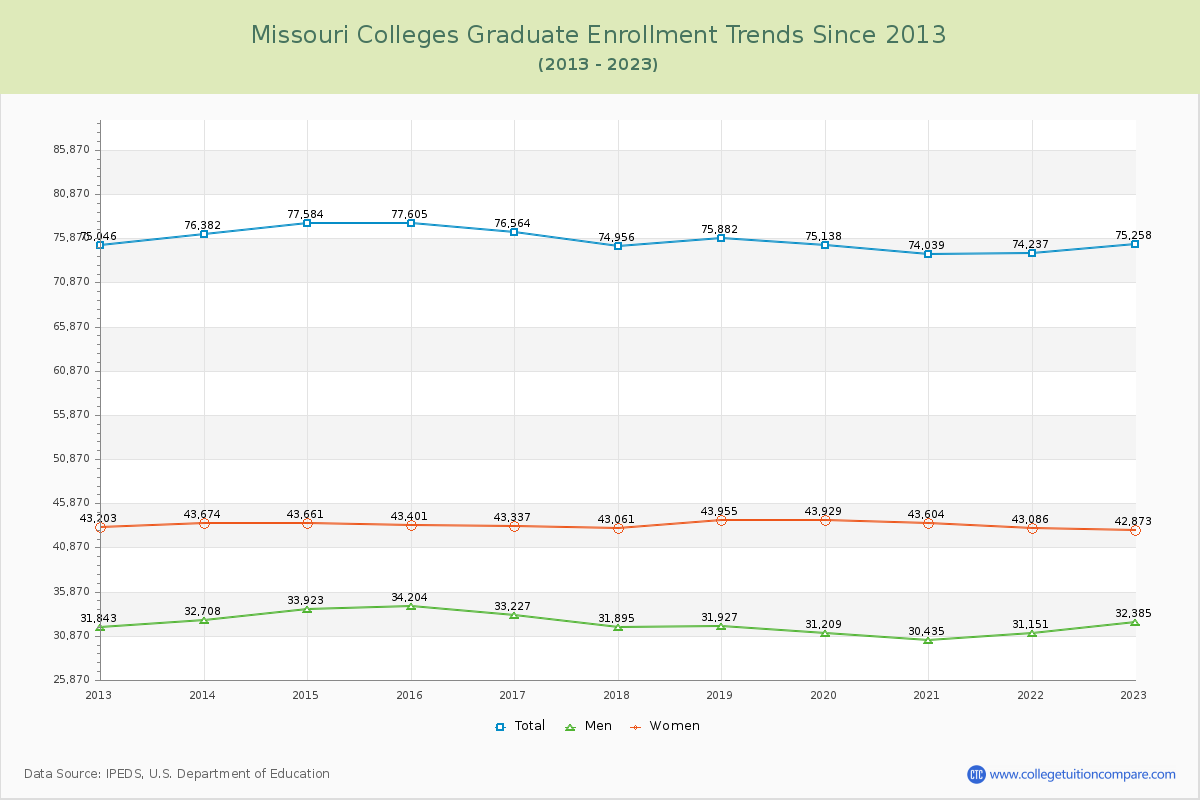
Student Population Changes
The average number of students over the past 11 years is 288,559, and 269,765 students were attending the schools in the academic year 2022-2023. Of the total students, 72.10% are undergraduate students and 27.90% are graduate students. Over the past 11, the number of undergraduate students decreased by 33,828, and the graduate student enrollment increased by 216.
The female to male ratio is 1.33 to 1, meaning that there are more female students enrolled in Missouri Colleges than male students.
The following table and chart illustrate the changes in student population by gender at Missouri Colleges since 2013.
| Year | Total | Undergraduate | Graduate | ||||
|---|---|---|---|---|---|---|---|
| Total | Men | Women | Total | Men | Women | ||
| 2012-13 | 303,404 | 228,358 | 100,719 | 127,639 | 75,046 | 31,843 | 43,203 |
| 2013-14 | 305,828 2,424 | 229,446 1,088 | 102,554 1,835 | 126,892 -747 | 76,382 1,336 | 32,708 865 | 43,674 471 |
| 2014-15 | 305,766 -62 | 228,182 -1,264 | 101,370 -1,184 | 126,812 -80 | 77,584 1,202 | 33,923 1,215 | 43,661 -13 |
| 2015-16 | 303,731 -2,035 | 226,126 -2,056 | 100,195 -1,175 | 125,931 -881 | 77,605 21 | 34,204 281 | 43,401 -260 |
| 2016-17 | 302,222 -1,509 | 225,658 -468 | 99,794 -401 | 125,864 -67 | 76,564 -1,041 | 33,227 -977 | 43,337 -64 |
| 2017-18 | 291,426 -10,796 | 216,470 -9,188 | 95,022 -4,772 | 121,448 -4,416 | 74,956 -1,608 | 31,895 -1,332 | 43,061 -276 |
| 2018-19 | 286,549 -4,877 | 210,667 -5,803 | 93,037 -1,985 | 117,630 -3,818 | 75,882 926 | 31,927 32 | 43,955 894 |
| 2019-20 | 278,289 -8,260 | 203,151 -7,516 | 89,205 -3,832 | 113,946 -3,684 | 75,138 -744 | 31,209 -718 | 43,929 -26 |
| 2020-21 | 265,840 -12,449 | 191,801 -11,350 | 82,969 -6,236 | 108,832 -5,114 | 74,039 -1,099 | 30,435 -774 | 43,604 -325 |
| 2021-22 | 261,324 -4,516 | 187,087 -4,714 | 80,538 -2,431 | 106,549 -2,283 | 74,237 198 | 31,151 716 | 43,086 -518 |
| 2022-23 | 269,765 8,441 | 194,507 7,420 | 83,455 2,917 | 111,052 4,503 | 75,258 1,021 | 32,385 1,234 | 42,873 -213 |
| Average | 288,559 | 212,859 | 93,533 | 119,327 | 75,699 | 32,264 | 43,435 |