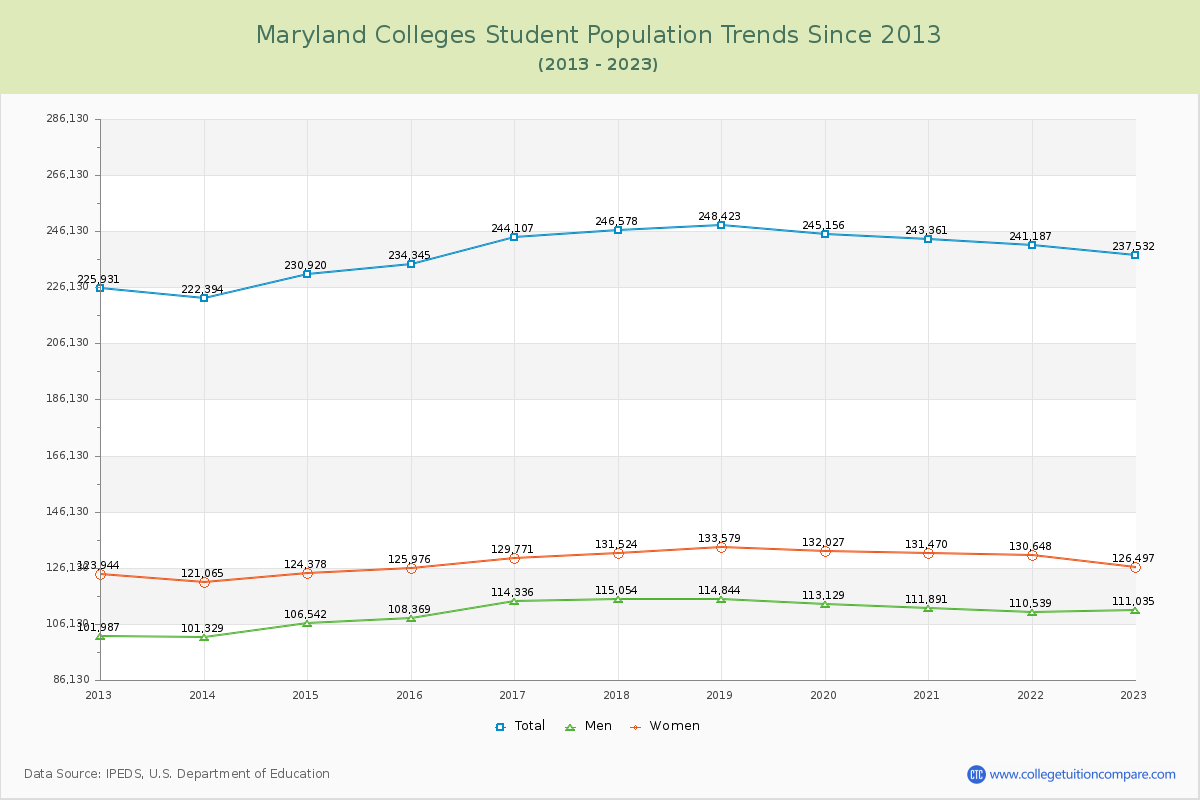
Student Population Changes
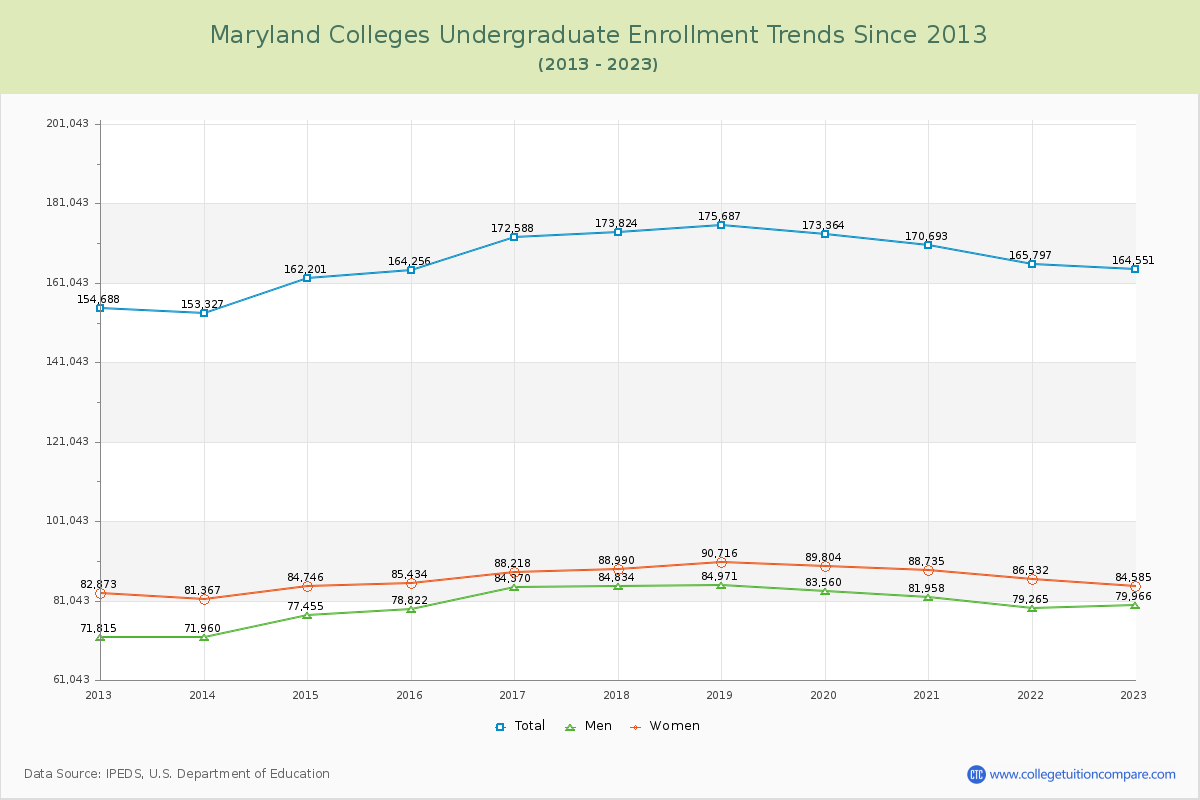
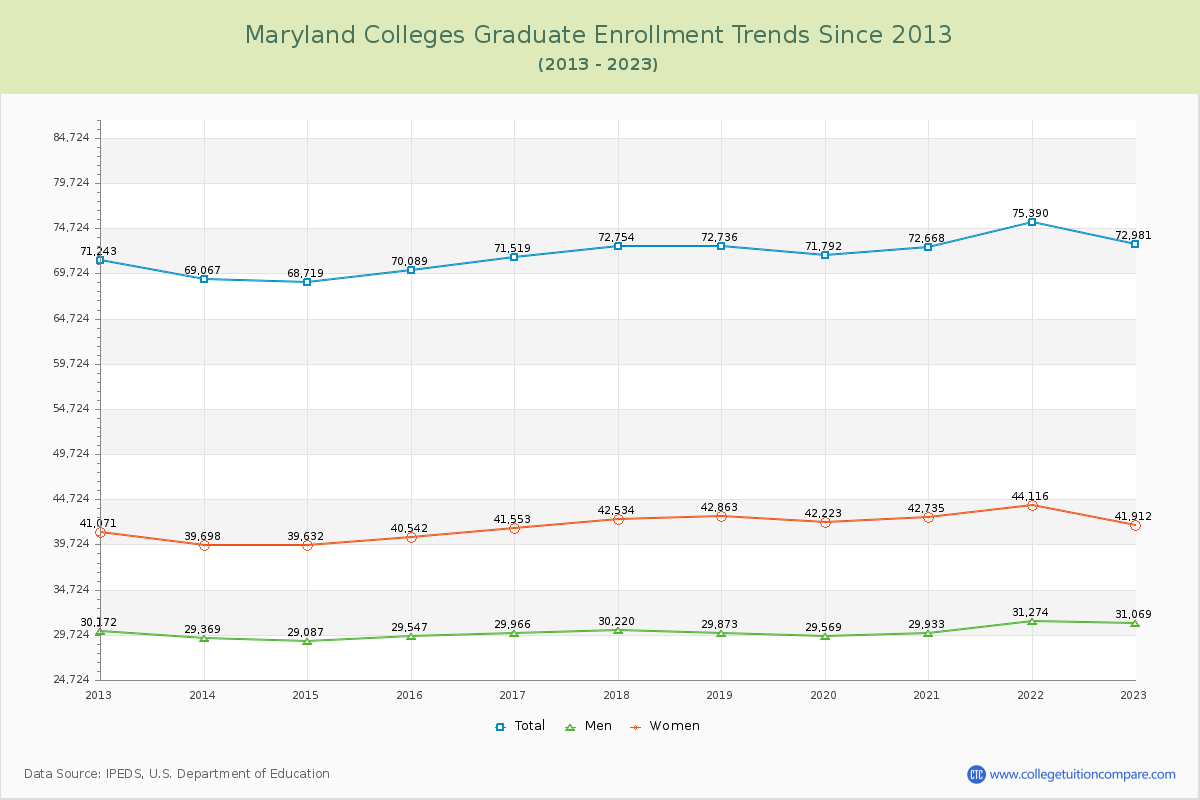
The average number of students over the past 11 years is 238,176, and 237,532 students were attending the schools in the academic year 2022-2023. Of the total students, 69.28% are undergraduate students and 30.72% are graduate students. Over the past 11, the number of undergraduate students increased by 9,863, and the graduate student enrollment increased by 1,738.
The female to male ratio is 1.14 to 1, meaning that there are slightly more female students enrolled in Maryland Colleges than male students.
The following table and chart illustrate the changes in student population by gender at Maryland Colleges since 2013.
| Year | Total | Undergraduate | Graduate | ||||
|---|---|---|---|---|---|---|---|
| Total | Men | Women | Total | Men | Women | ||
| 2012-13 | 225,931 | 154,688 | 71,815 | 82,873 | 71,243 | 30,172 | 41,071 |
| 2013-14 | 222,394 -3,537 | 153,327 -1,361 | 71,960 145 | 81,367 -1,506 | 69,067 -2,176 | 29,369 -803 | 39,698 -1,373 |
| 2014-15 | 230,920 8,526 | 162,201 8,874 | 77,455 5,495 | 84,746 3,379 | 68,719 -348 | 29,087 -282 | 39,632 -66 |
| 2015-16 | 234,345 3,425 | 164,256 2,055 | 78,822 1,367 | 85,434 688 | 70,089 1,370 | 29,547 460 | 40,542 910 |
| 2016-17 | 244,107 9,762 | 172,588 8,332 | 84,370 5,548 | 88,218 2,784 | 71,519 1,430 | 29,966 419 | 41,553 1,011 |
| 2017-18 | 246,578 2,471 | 173,824 1,236 | 84,834 464 | 88,990 772 | 72,754 1,235 | 30,220 254 | 42,534 981 |
| 2018-19 | 248,423 1,845 | 175,687 1,863 | 84,971 137 | 90,716 1,726 | 72,736 -18 | 29,873 -347 | 42,863 329 |
| 2019-20 | 245,156 -3,267 | 173,364 -2,323 | 83,560 -1,411 | 89,804 -912 | 71,792 -944 | 29,569 -304 | 42,223 -640 |
| 2020-21 | 243,361 -1,795 | 170,693 -2,671 | 81,958 -1,602 | 88,735 -1,069 | 72,668 876 | 29,933 364 | 42,735 512 |
| 2021-22 | 241,187 -2,174 | 165,797 -4,896 | 79,265 -2,693 | 86,532 -2,203 | 75,390 2,722 | 31,274 1,341 | 44,116 1,381 |
| 2022-23 | 237,532 -3,655 | 164,551 -1,246 | 79,966 701 | 84,585 -1,947 | 72,981 -2,409 | 31,069 -205 | 41,912 -2,204 |
| Average | 238,176 | 166,452 | 79,907 | 86,545 | 71,723 | 30,007 | 41,716 |