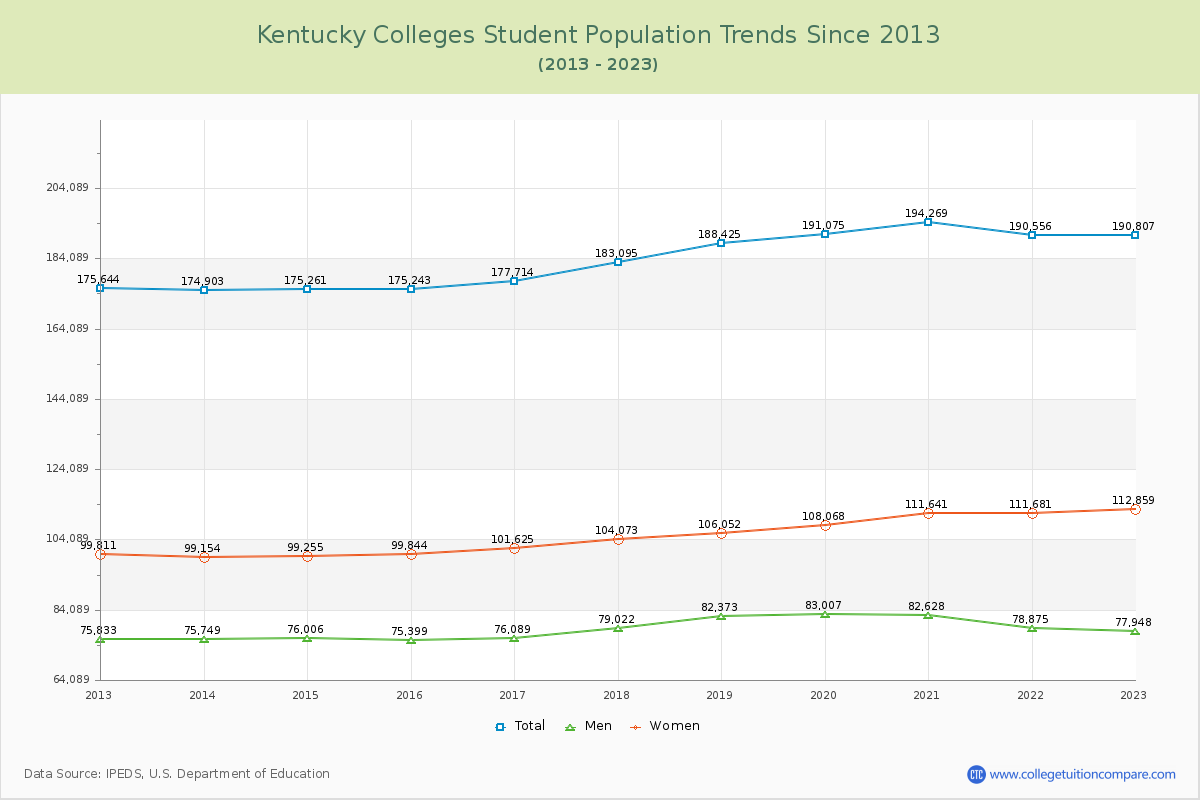
Student Population Changes
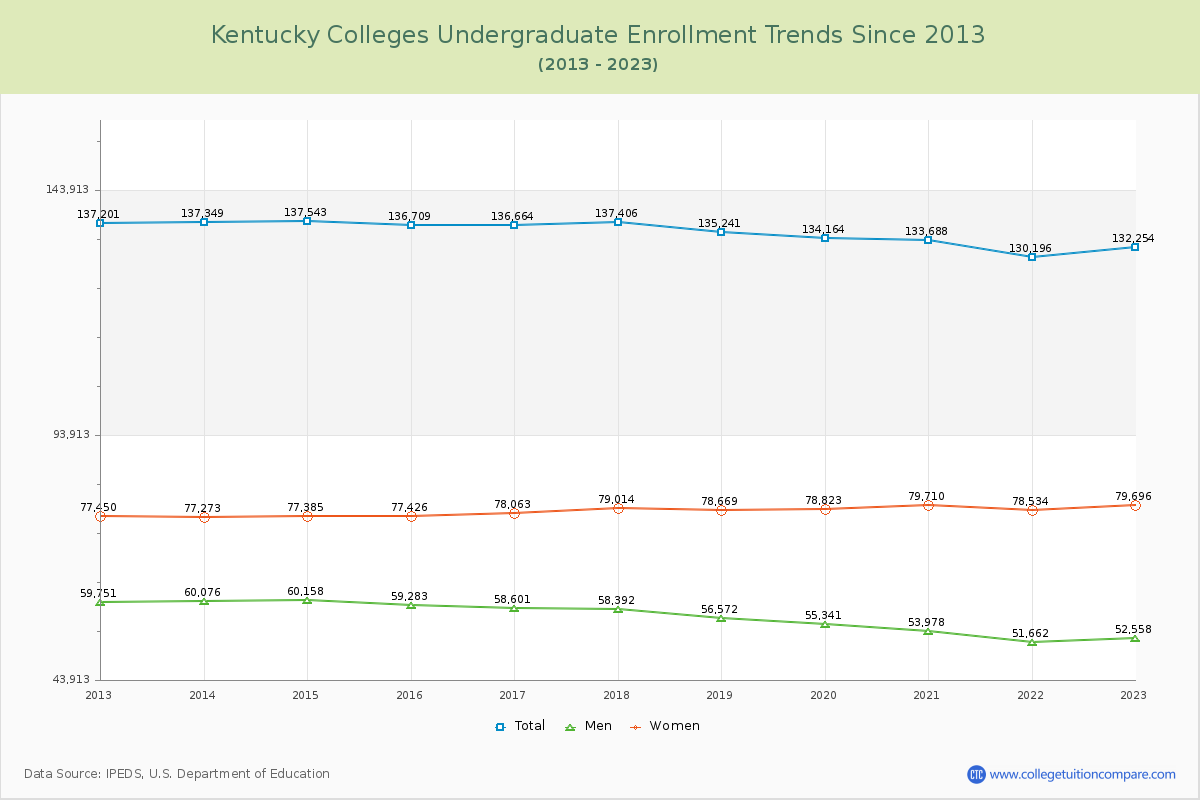
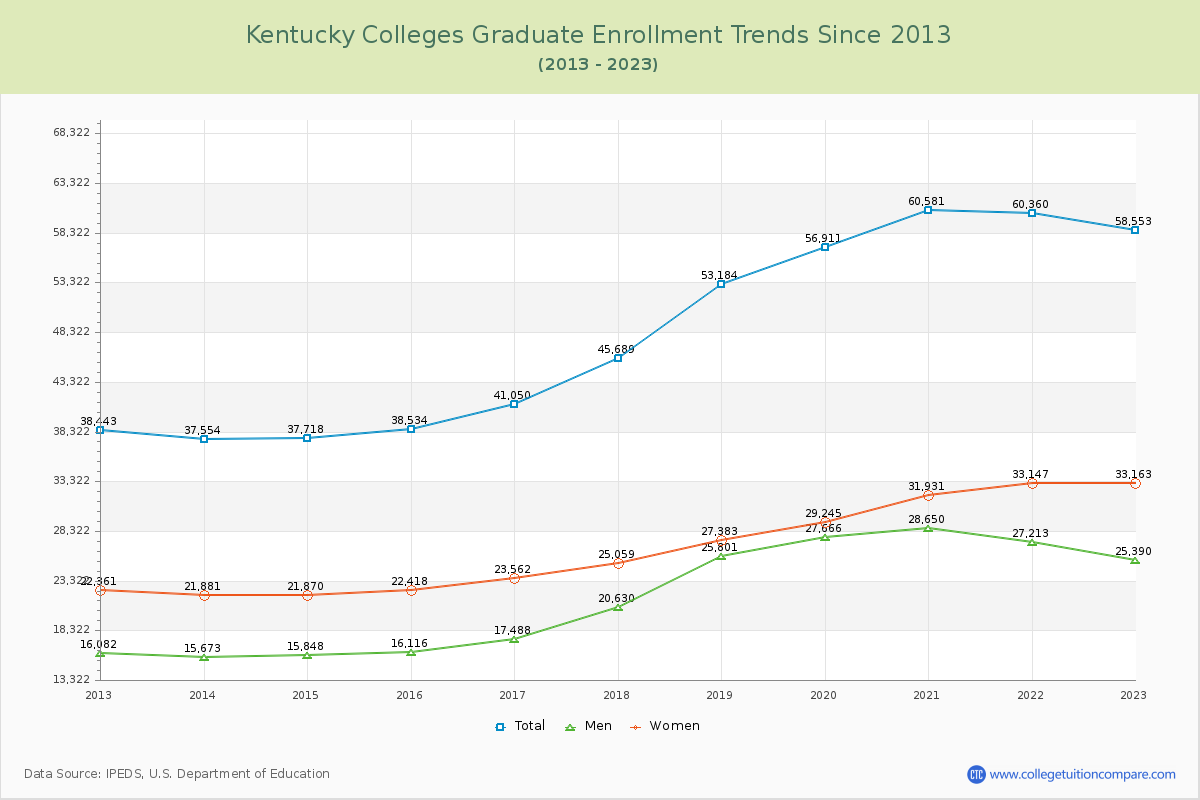
The average number of students over the past 11 years is 183,363, and 190,807 students were attending the schools in the academic year 2022-2023. Of the total students, 69.31% are undergraduate students and 30.69% are graduate students. Over the past 11, the number of undergraduate students decreased by 4,947, and the graduate student enrollment increased by 20,110.
The female to male ratio is 1.45 to 1, meaning that there are more female students enrolled in Kentucky Colleges than male students.
The following table and chart illustrate the changes in student population by gender at Kentucky Colleges since 2013.
| Year | Total | Undergraduate | Graduate | ||||
|---|---|---|---|---|---|---|---|
| Total | Men | Women | Total | Men | Women | ||
| 2012-13 | 175,644 | 137,201 | 59,751 | 77,450 | 38,443 | 16,082 | 22,361 |
| 2013-14 | 174,903 -741 | 137,349 148 | 60,076 325 | 77,273 -177 | 37,554 -889 | 15,673 -409 | 21,881 -480 |
| 2014-15 | 175,261 358 | 137,543 194 | 60,158 82 | 77,385 112 | 37,718 164 | 15,848 175 | 21,870 -11 |
| 2015-16 | 175,243 -18 | 136,709 -834 | 59,283 -875 | 77,426 41 | 38,534 816 | 16,116 268 | 22,418 548 |
| 2016-17 | 177,714 2,471 | 136,664 -45 | 58,601 -682 | 78,063 637 | 41,050 2,516 | 17,488 1,372 | 23,562 1,144 |
| 2017-18 | 183,095 5,381 | 137,406 742 | 58,392 -209 | 79,014 951 | 45,689 4,639 | 20,630 3,142 | 25,059 1,497 |
| 2018-19 | 188,425 5,330 | 135,241 -2,165 | 56,572 -1,820 | 78,669 -345 | 53,184 7,495 | 25,801 5,171 | 27,383 2,324 |
| 2019-20 | 191,075 2,650 | 134,164 -1,077 | 55,341 -1,231 | 78,823 154 | 56,911 3,727 | 27,666 1,865 | 29,245 1,862 |
| 2020-21 | 194,269 3,194 | 133,688 -476 | 53,978 -1,363 | 79,710 887 | 60,581 3,670 | 28,650 984 | 31,931 2,686 |
| 2021-22 | 190,556 -3,713 | 130,196 -3,492 | 51,662 -2,316 | 78,534 -1,176 | 60,360 -221 | 27,213 -1,437 | 33,147 1,216 |
| 2022-23 | 190,807 251 | 132,254 2,058 | 52,558 896 | 79,696 1,162 | 58,553 -1,807 | 25,390 -1,823 | 33,163 16 |
| Average | 183,363 | 135,310 | 56,943 | 78,368 | 48,052 | 21,505 | 26,547 |