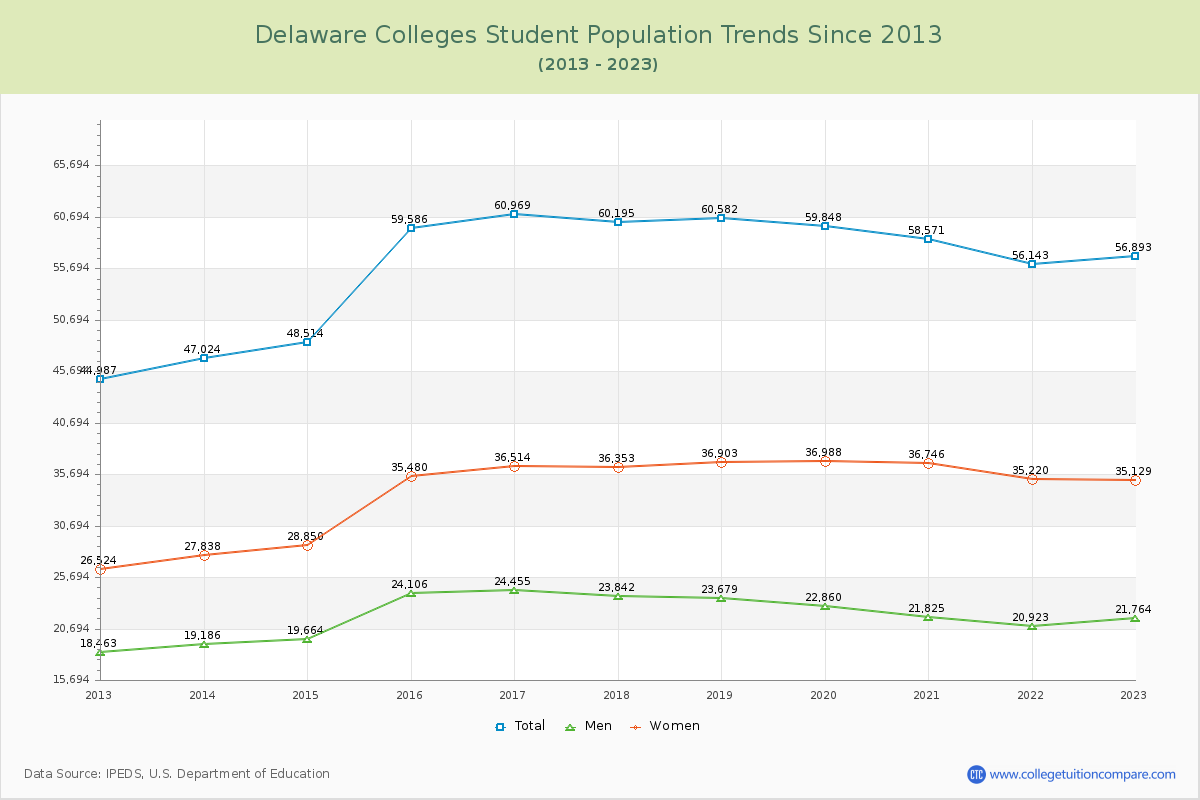
Student Population Changes
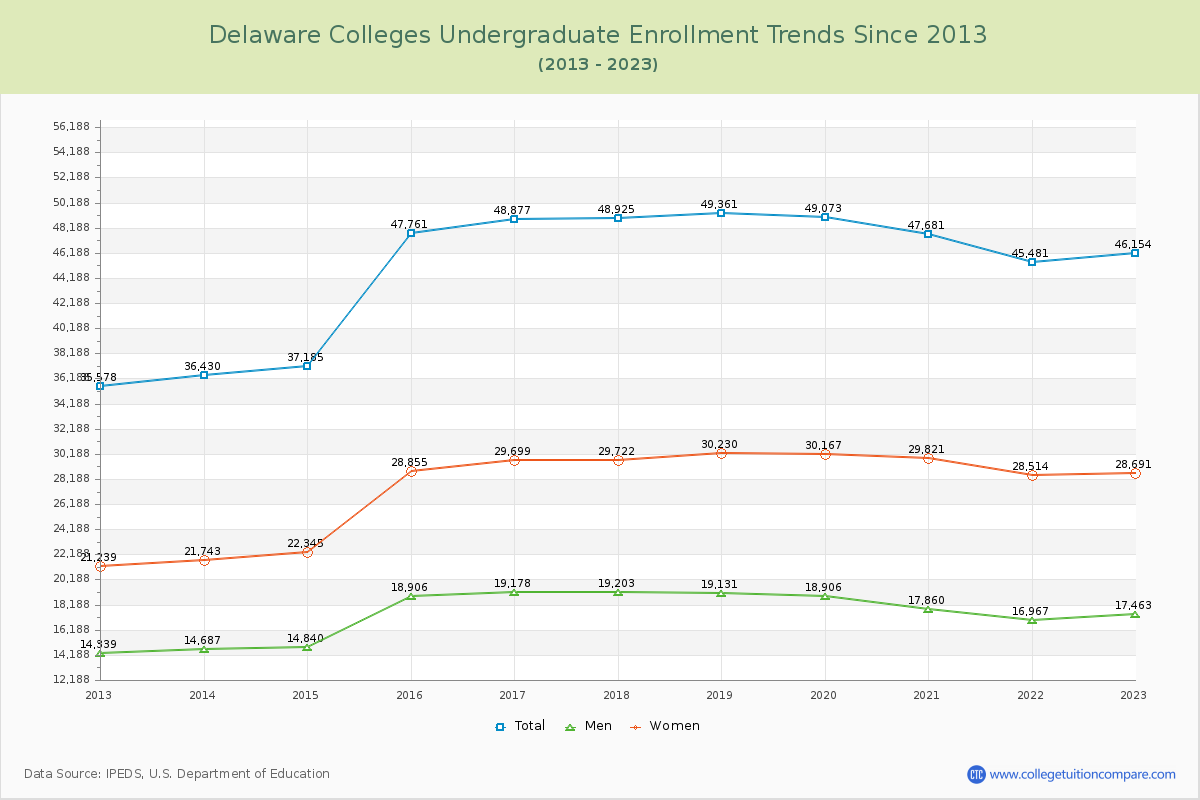
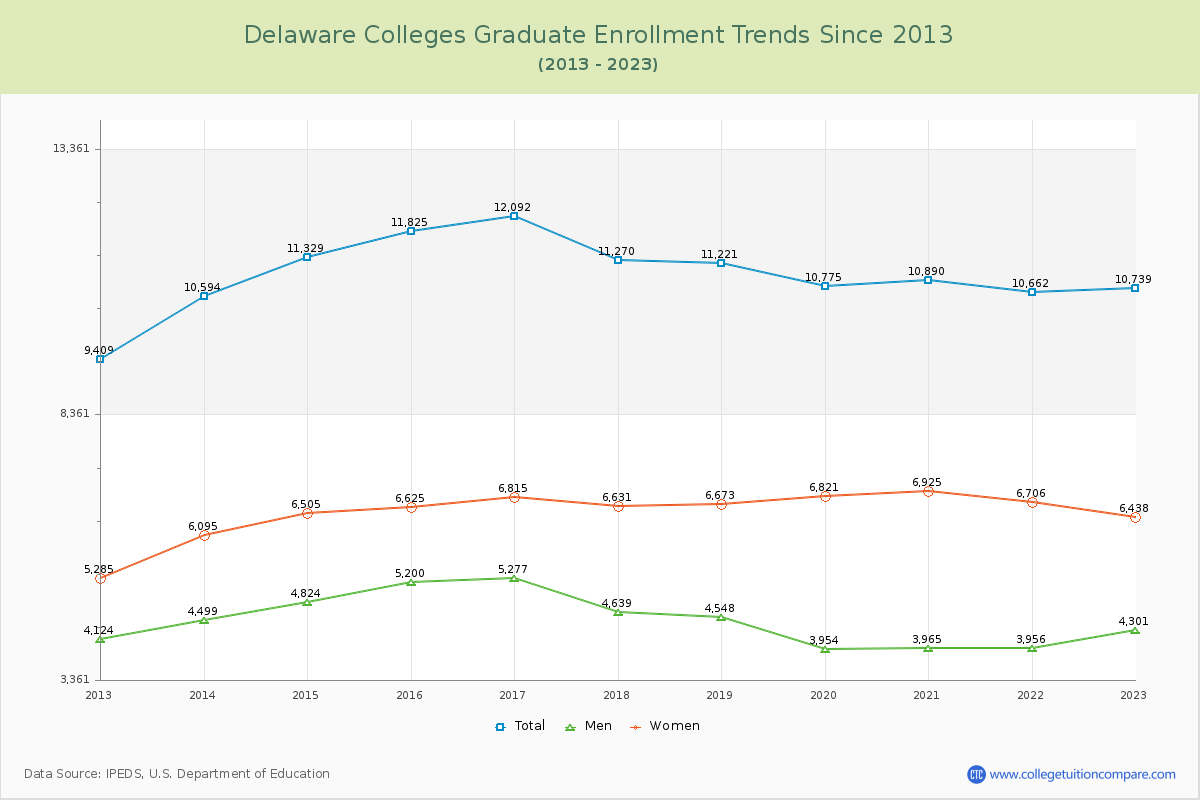
The average number of students over the past 11 years is 55,756, and 56,893 students were attending the schools in the academic year 2022-2023. Of the total students, 81.12% are undergraduate students and 18.88% are graduate students. Over the past 11, the number of undergraduate students increased by 10,576, and the graduate student enrollment increased by 1,330.
The female to male ratio is 1.61 to 1, meaning that there are more female students enrolled in Delaware Colleges than male students.
The following table and chart illustrate the changes in student population by gender at Delaware Colleges since 2013.
| Year | Total | Undergraduate | Graduate | ||||
|---|---|---|---|---|---|---|---|
| Total | Men | Women | Total | Men | Women | ||
| 2012-13 | 44,987 | 35,578 | 14,339 | 21,239 | 9,409 | 4,124 | 5,285 |
| 2013-14 | 47,024 2,037 | 36,430 852 | 14,687 348 | 21,743 504 | 10,594 1,185 | 4,499 375 | 6,095 810 |
| 2014-15 | 48,514 1,490 | 37,185 755 | 14,840 153 | 22,345 602 | 11,329 735 | 4,824 325 | 6,505 410 |
| 2015-16 | 59,586 11,072 | 47,761 10,576 | 18,906 4,066 | 28,855 6,510 | 11,825 496 | 5,200 376 | 6,625 120 |
| 2016-17 | 60,969 1,383 | 48,877 1,116 | 19,178 272 | 29,699 844 | 12,092 267 | 5,277 77 | 6,815 190 |
| 2017-18 | 60,195 -774 | 48,925 48 | 19,203 25 | 29,722 23 | 11,270 -822 | 4,639 -638 | 6,631 -184 |
| 2018-19 | 60,582 387 | 49,361 436 | 19,131 -72 | 30,230 508 | 11,221 -49 | 4,548 -91 | 6,673 42 |
| 2019-20 | 59,848 -734 | 49,073 -288 | 18,906 -225 | 30,167 -63 | 10,775 -446 | 3,954 -594 | 6,821 148 |
| 2020-21 | 58,571 -1,277 | 47,681 -1,392 | 17,860 -1,046 | 29,821 -346 | 10,890 115 | 3,965 11 | 6,925 104 |
| 2021-22 | 56,143 -2,428 | 45,481 -2,200 | 16,967 -893 | 28,514 -1,307 | 10,662 -228 | 3,956 -9 | 6,706 -219 |
| 2022-23 | 56,893 750 | 46,154 673 | 17,463 496 | 28,691 177 | 10,739 77 | 4,301 345 | 6,438 -268 |
| Average | 55,756 | 44,773 | 17,407 | 27,366 | 10,982 | 4,481 | 6,502 |