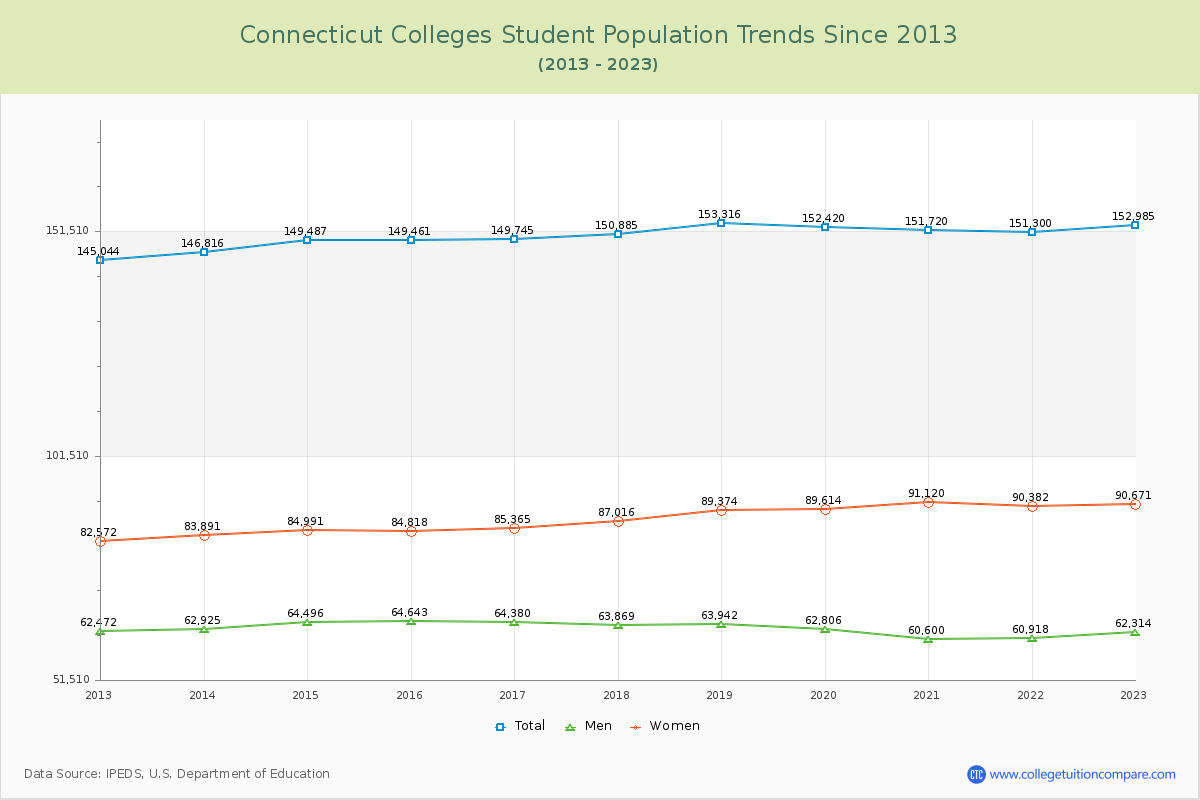
Student Population Changes
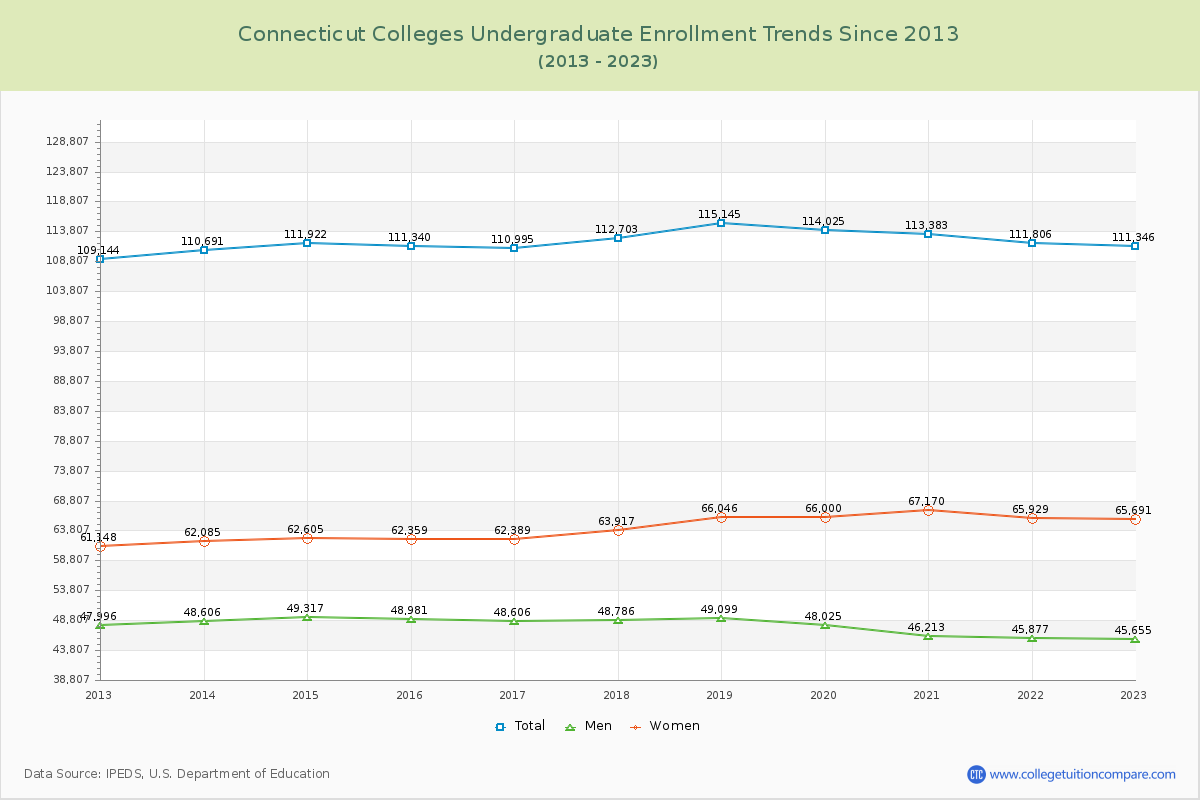
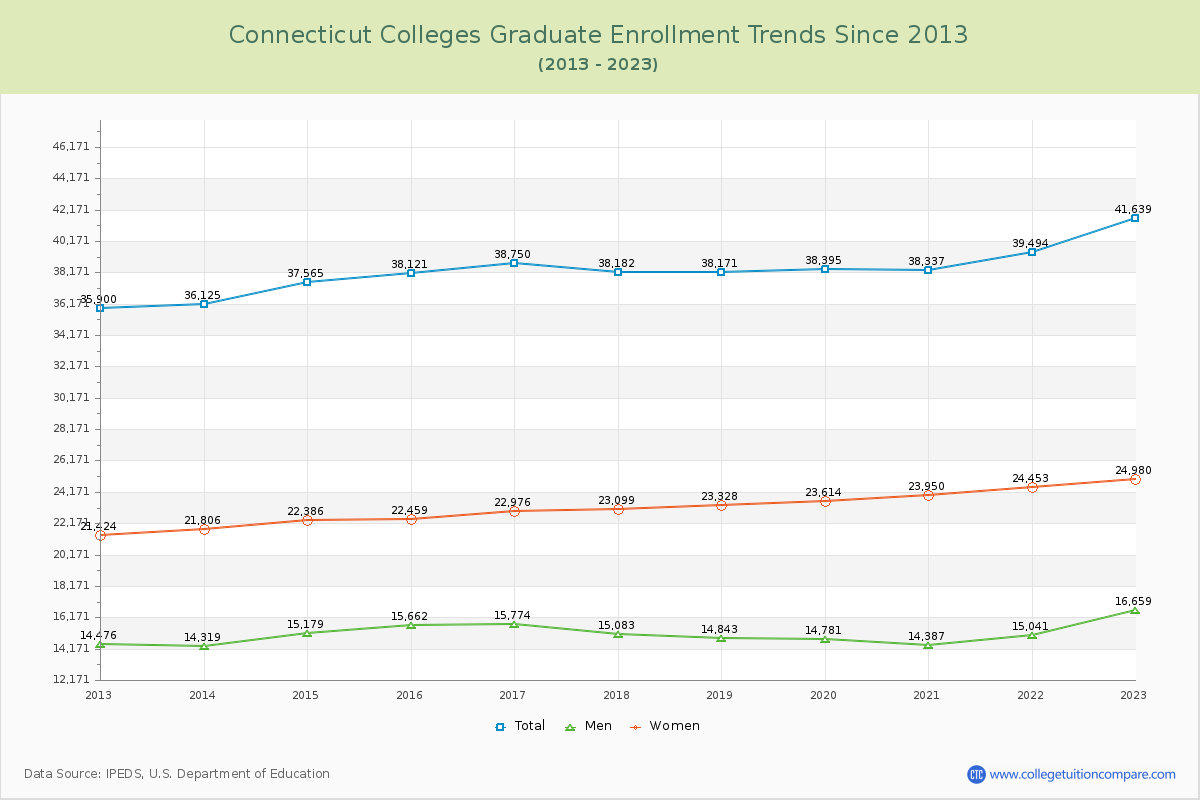
The average number of students over the past 11 years is 150,289, and 152,985 students were attending the schools in the academic year 2022-2023. Of the total students, 72.78% are undergraduate students and 27.22% are graduate students. Over the past 11, the number of undergraduate students increased by 2,202, and the graduate student enrollment increased by 5,739.
The female to male ratio is 1.46 to 1, meaning that there are more female students enrolled in Connecticut Colleges than male students.
The following table and chart illustrate the changes in student population by gender at Connecticut Colleges since 2013.
| Year | Total | Undergraduate | Graduate | ||||
|---|---|---|---|---|---|---|---|
| Total | Men | Women | Total | Men | Women | ||
| 2012-13 | 145,044 | 109,144 | 47,996 | 61,148 | 35,900 | 14,476 | 21,424 |
| 2013-14 | 146,816 1,772 | 110,691 1,547 | 48,606 610 | 62,085 937 | 36,125 225 | 14,319 -157 | 21,806 382 |
| 2014-15 | 149,487 2,671 | 111,922 1,231 | 49,317 711 | 62,605 520 | 37,565 1,440 | 15,179 860 | 22,386 580 |
| 2015-16 | 149,461 -26 | 111,340 -582 | 48,981 -336 | 62,359 -246 | 38,121 556 | 15,662 483 | 22,459 73 |
| 2016-17 | 149,745 284 | 110,995 -345 | 48,606 -375 | 62,389 30 | 38,750 629 | 15,774 112 | 22,976 517 |
| 2017-18 | 150,885 1,140 | 112,703 1,708 | 48,786 180 | 63,917 1,528 | 38,182 -568 | 15,083 -691 | 23,099 123 |
| 2018-19 | 153,316 2,431 | 115,145 2,442 | 49,099 313 | 66,046 2,129 | 38,171 -11 | 14,843 -240 | 23,328 229 |
| 2019-20 | 152,420 -896 | 114,025 -1,120 | 48,025 -1,074 | 66,000 -46 | 38,395 224 | 14,781 -62 | 23,614 286 |
| 2020-21 | 151,720 -700 | 113,383 -642 | 46,213 -1,812 | 67,170 1,170 | 38,337 -58 | 14,387 -394 | 23,950 336 |
| 2021-22 | 151,300 -420 | 111,806 -1,577 | 45,877 -336 | 65,929 -1,241 | 39,494 1,157 | 15,041 654 | 24,453 503 |
| 2022-23 | 152,985 1,685 | 111,346 -460 | 45,655 -222 | 65,691 -238 | 41,639 2,145 | 16,659 1,618 | 24,980 527 |
| Average | 150,289 | 112,045 | 47,924 | 64,122 | 38,244 | 15,109 | 23,134 |