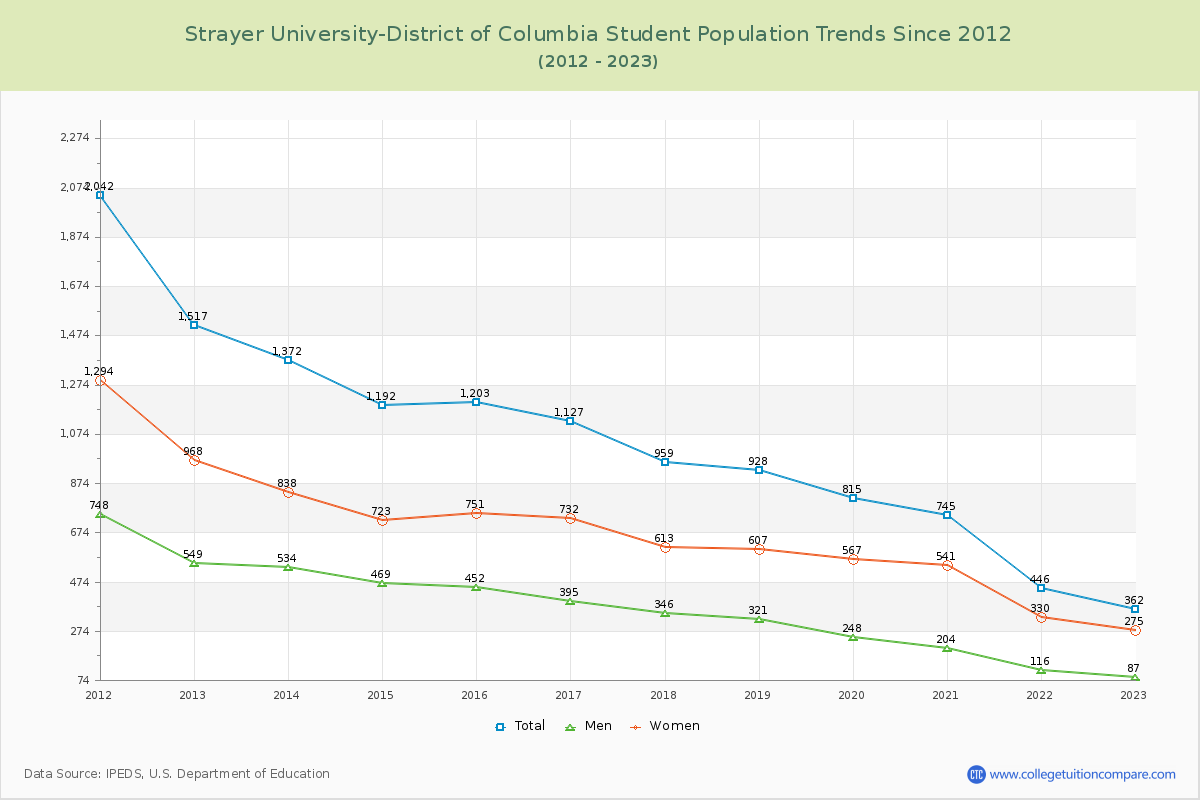
Student Population Changes
The average student population over the last 12 years is 970 where 362 students are attending the school for the academic year 2022-2023.
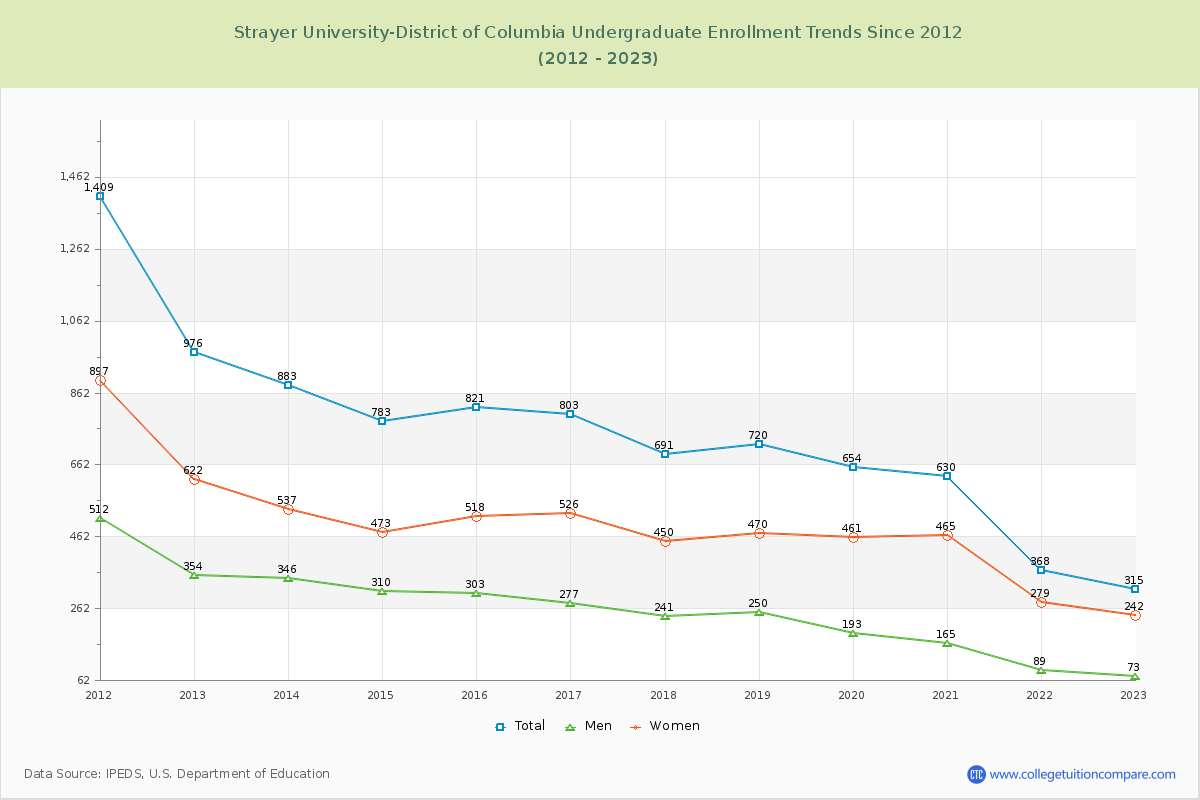
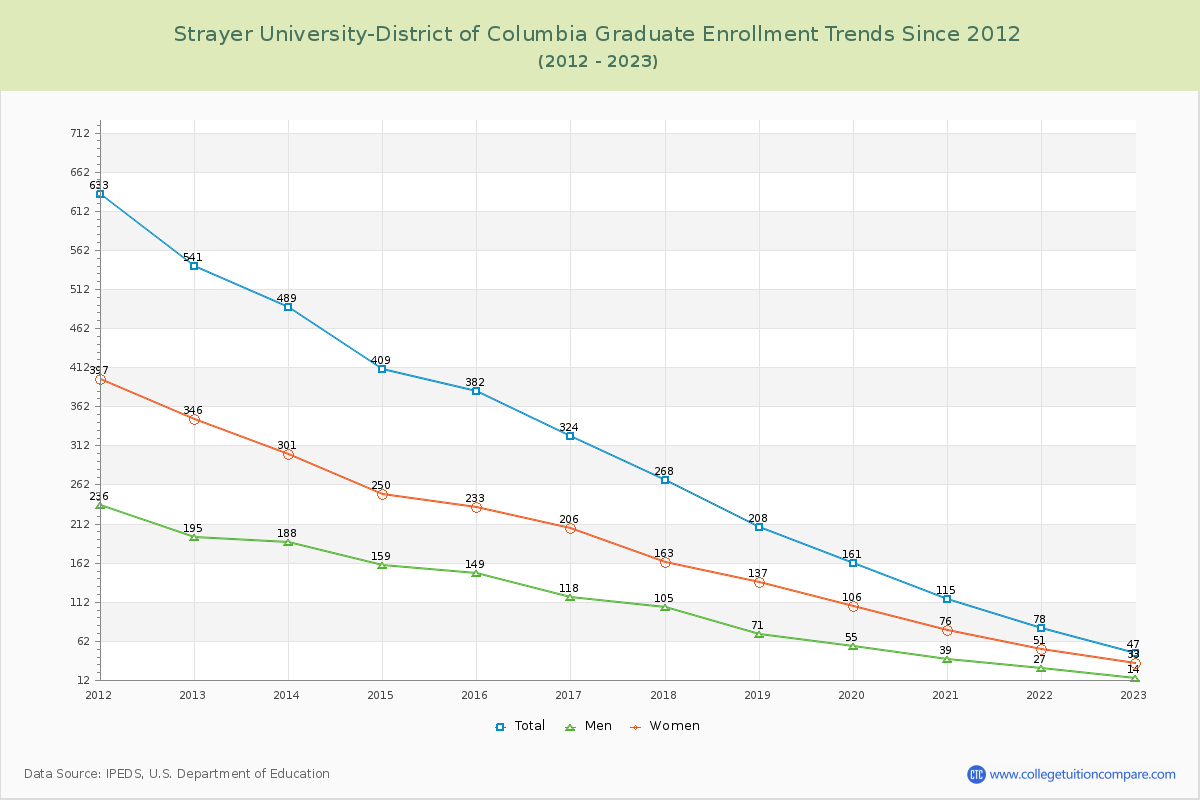
87.02% of total students is undergraduate students and 12.98% students is graduate students. The number of undergraduate students has decreased by 661 and the graduate enrollment has decreased by 494 over past 10 years.
The female to male ratio is 3.16 to 1 and it means that there are far more female students enrolled in Strayer University-District of Columbia than male students.
The following table and chart illustrate the changes in student population by gender at Strayer University-District of Columbia since 2012.
| Year | Total | Undergraduate | Graduate | ||||
|---|---|---|---|---|---|---|---|
| Total | Men | Women | Total | Men | Women | ||
| 2012-13 | 1,517 | 976 | 354 | 622 | 541 | 195 | 346 |
| 2013-14 | 1,372 -145 | 883 -93 | 346 -8 | 537 -85 | 489 -52 | 188 -7 | 301 -45 |
| 2014-15 | 1,192 -180 | 783 -100 | 310 -36 | 473 -64 | 409 -80 | 159 -29 | 250 -51 |
| 2015-16 | 1,203 11 | 821 38 | 303 -7 | 518 45 | 382 -27 | 149 -10 | 233 -17 |
| 2016-17 | 1,127 -76 | 803 -18 | 277 -26 | 526 8 | 324 -58 | 118 -31 | 206 -27 |
| 2017-18 | 959 -168 | 691 -112 | 241 -36 | 450 -76 | 268 -56 | 105 -13 | 163 -43 |
| 2018-19 | 928 -31 | 720 29 | 250 9 | 470 20 | 208 -60 | 71 -34 | 137 -26 |
| 2019-20 | 815 -113 | 654 -66 | 193 -57 | 461 -9 | 161 -47 | 55 -16 | 106 -31 |
| 2020-21 | 745 -70 | 630 -24 | 165 -28 | 465 4 | 115 -46 | 39 -16 | 76 -30 |
| 2021-22 | 446 -299 | 368 -262 | 89 -76 | 279 -186 | 78 -37 | 27 -12 | 51 -25 |
| 2022-23 | 362 -84 | 315 -53 | 73 -16 | 242 -37 | 47 -31 | 14 -13 | 33 -18 |
| Average | 970 | 695 | 236 | 458 | 275 | 102 | 173 |