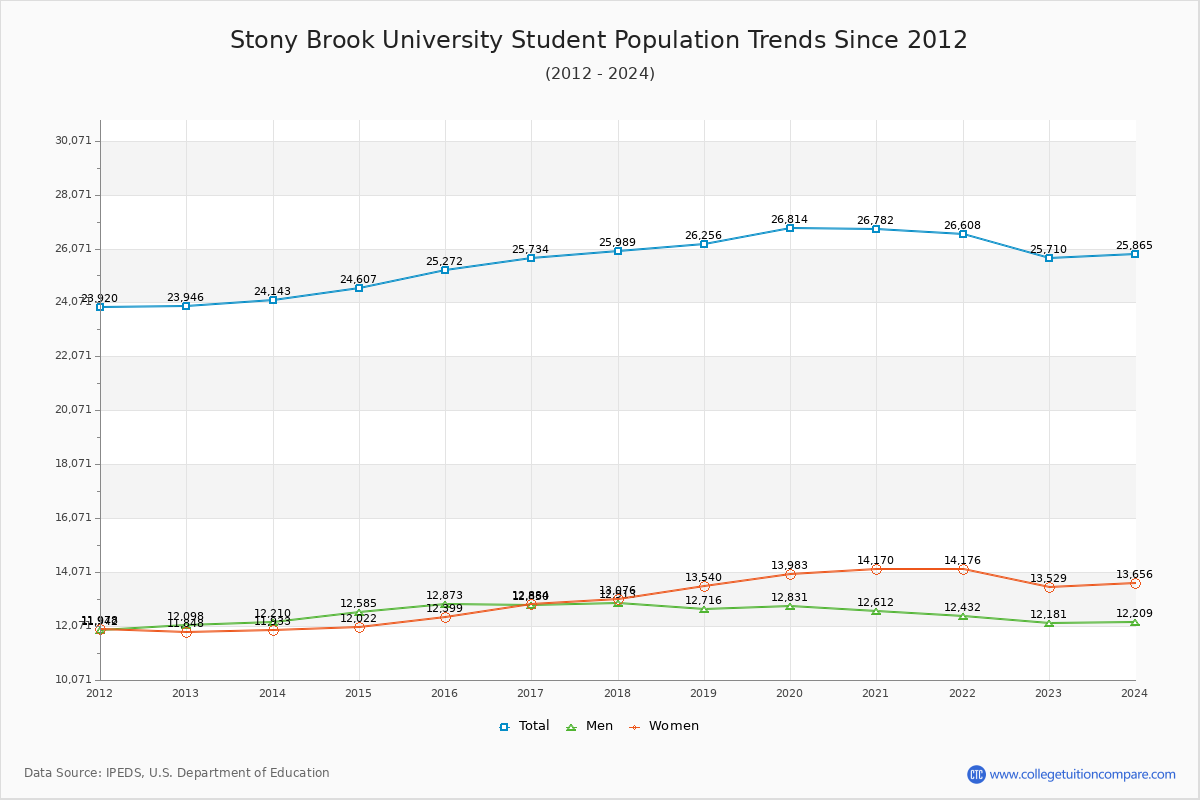
Student Population Changes
The average student population over the last 12 years is 25,624 where 25,710 students are attending the school for the academic year 2022-2023.
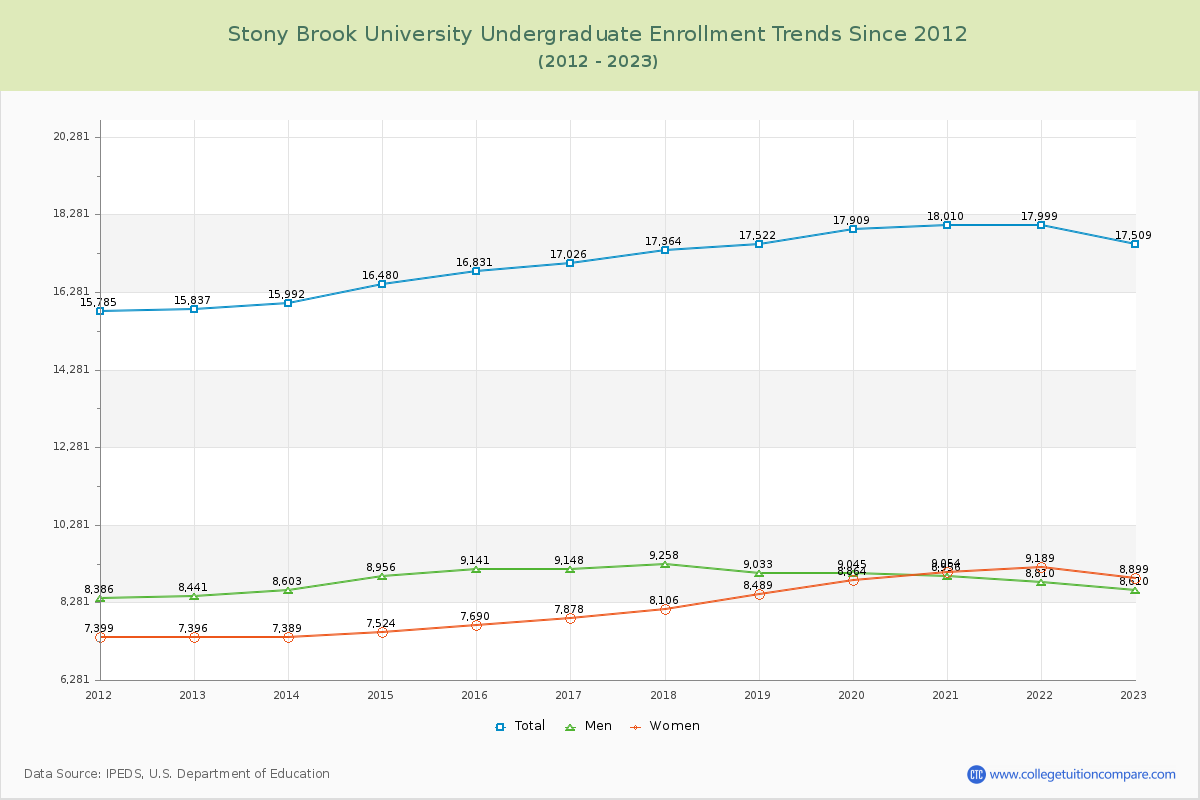
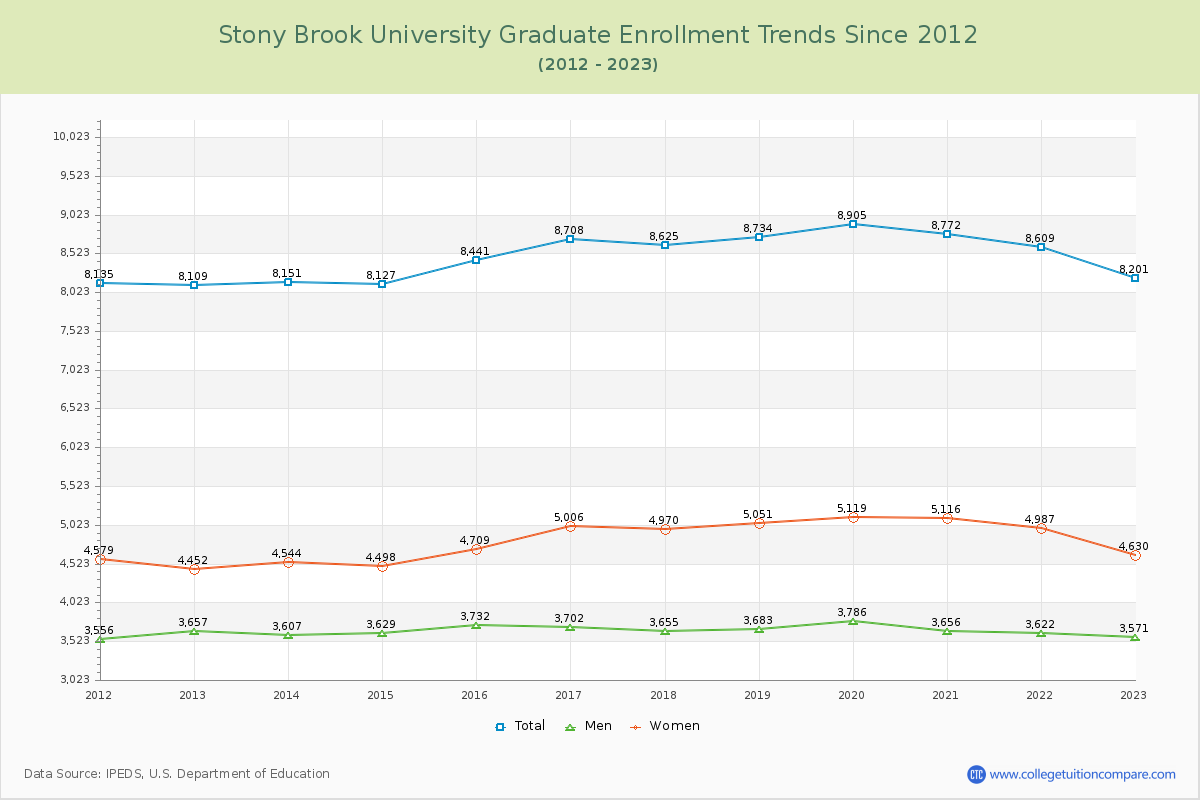
68.10% of total students is undergraduate students and 31.90% students is graduate students. The number of undergraduate students has increased by 1,672 and the graduate enrollment has increased by 92 over past 10 years.
The female to male ratio is 1.11 to 1 and it means that there are slightly more female students enrolled in SUNY Stony Brook than male students.
The following table and chart illustrate the changes in student population by gender at Stony Brook University since 2012.
| Year | Total | Undergraduate | Graduate | ||||
|---|---|---|---|---|---|---|---|
| Total | Men | Women | Total | Men | Women | ||
| 2012-13 | 23,946 | 15,837 | 8,441 | 7,396 | 8,109 | 3,657 | 4,452 |
| 2013-14 | 24,143 197 | 15,992 155 | 8,603 162 | 7,389 -7 | 8,151 42 | 3,607 -50 | 4,544 92 |
| 2014-15 | 24,607 464 | 16,480 488 | 8,956 353 | 7,524 135 | 8,127 -24 | 3,629 22 | 4,498 -46 |
| 2015-16 | 25,272 665 | 16,831 351 | 9,141 185 | 7,690 166 | 8,441 314 | 3,732 103 | 4,709 211 |
| 2016-17 | 25,734 462 | 17,026 195 | 9,148 7 | 7,878 188 | 8,708 267 | 3,702 -30 | 5,006 297 |
| 2017-18 | 25,989 255 | 17,364 338 | 9,258 110 | 8,106 228 | 8,625 -83 | 3,655 -47 | 4,970 -36 |
| 2018-19 | 26,256 267 | 17,522 158 | 9,033 -225 | 8,489 383 | 8,734 109 | 3,683 28 | 5,051 81 |
| 2019-20 | 26,814 558 | 17,909 387 | 9,045 12 | 8,864 375 | 8,905 171 | 3,786 103 | 5,119 68 |
| 2020-21 | 26,782 -32 | 18,010 101 | 8,956 -89 | 9,054 190 | 8,772 -133 | 3,656 -130 | 5,116 -3 |
| 2021-22 | 26,608 -174 | 17,999 -11 | 8,810 -146 | 9,189 135 | 8,609 -163 | 3,622 -34 | 4,987 -129 |
| 2022-23 | 25,710 -898 | 17,509 -490 | 8,610 -200 | 8,899 -290 | 8,201 -408 | 3,571 -51 | 4,630 -357 |
| Average | 25,624 | 17,134 | 8,909 | 8,225 | 8,489 | 3,664 | 4,826 |