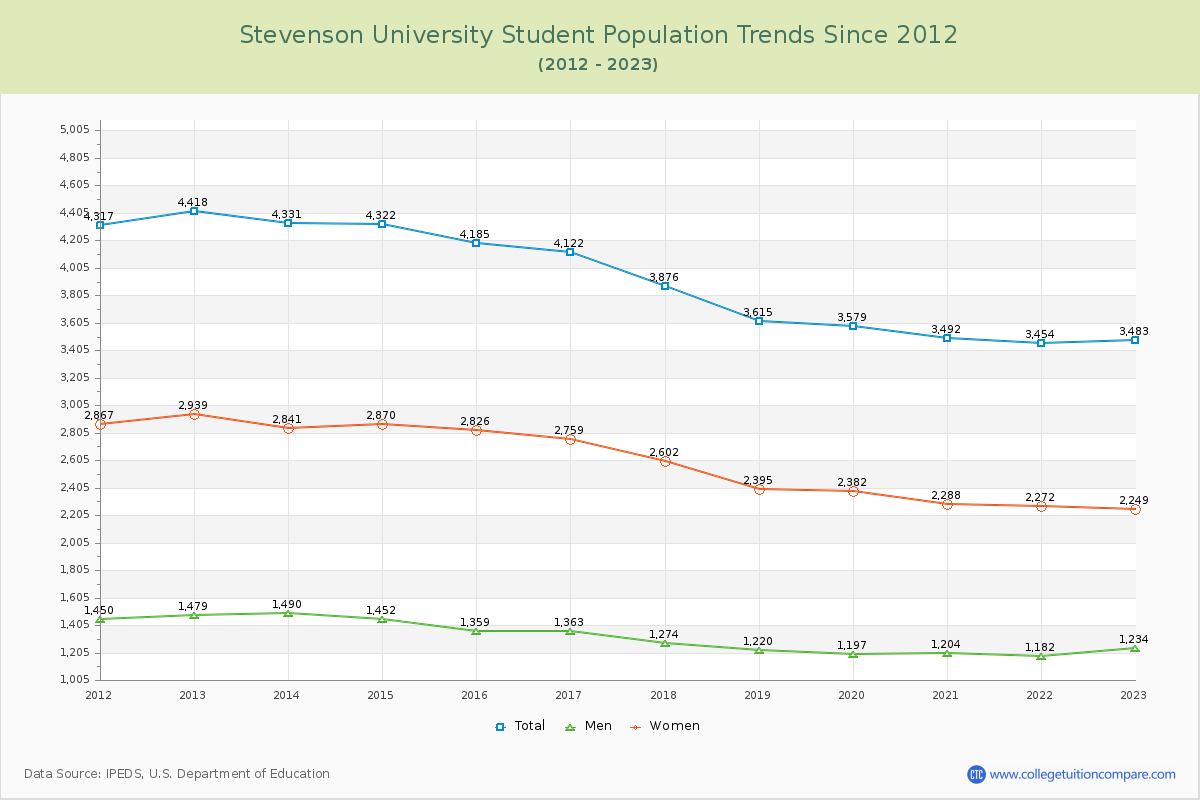
Student Population Changes
The average student population over the last 12 years is 3,898 where 3,483 students are attending the school for the academic year 2022-2023.
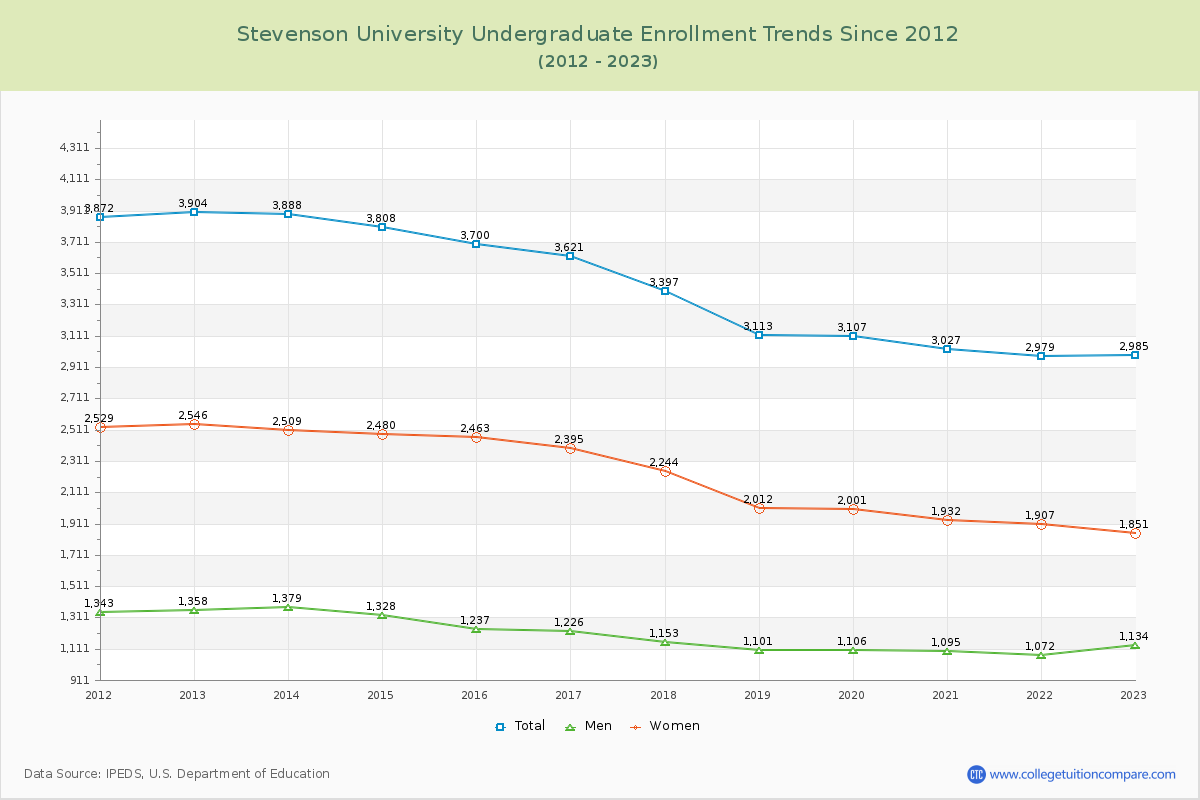
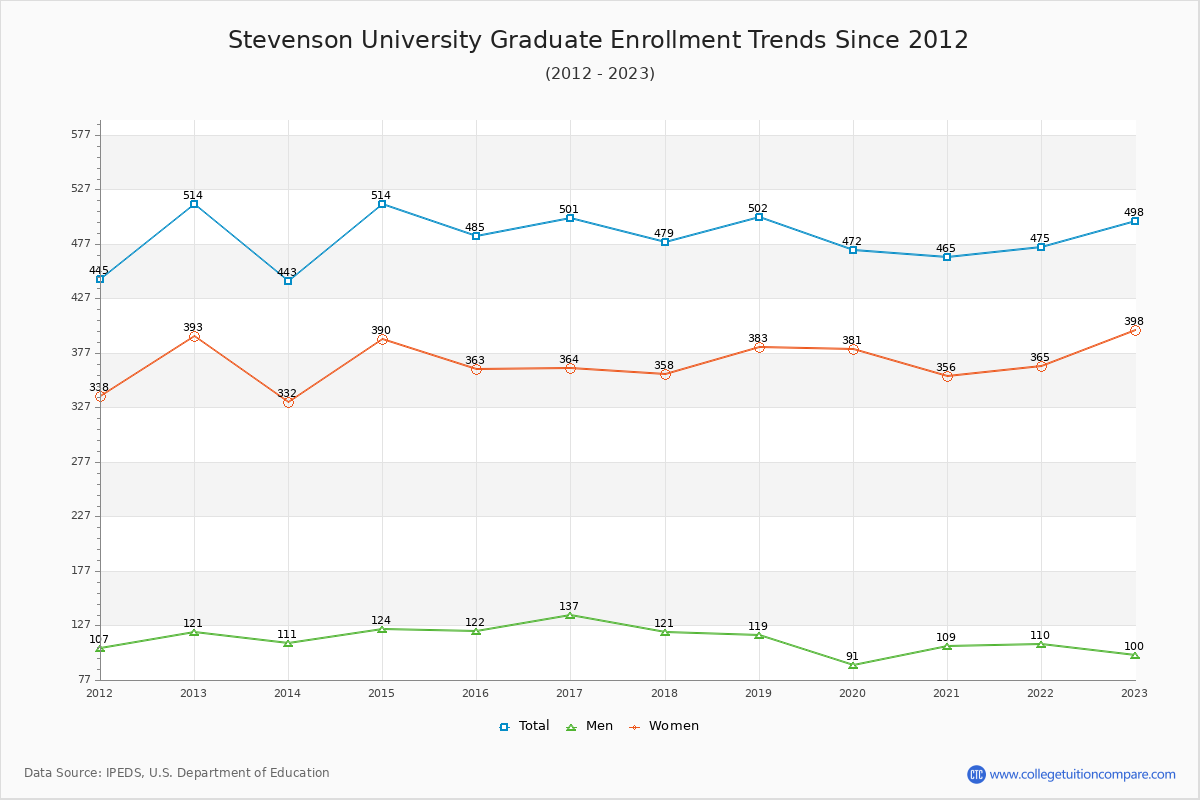
85.70% of total students is undergraduate students and 14.30% students is graduate students. The number of undergraduate students has decreased by 919 and the graduate enrollment has decreased by 16 over past 10 years.
The female to male ratio is 1.82 to 1 and it means that there are more female students enrolled in Stevenson than male students.
The following table and chart illustrate the changes in student population by gender at Stevenson University since 2012.
| Year | Total | Undergraduate | Graduate | ||||
|---|---|---|---|---|---|---|---|
| Total | Men | Women | Total | Men | Women | ||
| 2012-13 | 4,418 | 3,904 | 1,358 | 2,546 | 514 | 121 | 393 |
| 2013-14 | 4,331 -87 | 3,888 -16 | 1,379 21 | 2,509 -37 | 443 -71 | 111 -10 | 332 -61 |
| 2014-15 | 4,322 -9 | 3,808 -80 | 1,328 -51 | 2,480 -29 | 514 71 | 124 13 | 390 58 |
| 2015-16 | 4,185 -137 | 3,700 -108 | 1,237 -91 | 2,463 -17 | 485 -29 | 122 -2 | 363 -27 |
| 2016-17 | 4,122 -63 | 3,621 -79 | 1,226 -11 | 2,395 -68 | 501 16 | 137 15 | 364 1 |
| 2017-18 | 3,876 -246 | 3,397 -224 | 1,153 -73 | 2,244 -151 | 479 -22 | 121 -16 | 358 -6 |
| 2018-19 | 3,615 -261 | 3,113 -284 | 1,101 -52 | 2,012 -232 | 502 23 | 119 -2 | 383 25 |
| 2019-20 | 3,579 -36 | 3,107 -6 | 1,106 5 | 2,001 -11 | 472 -30 | 91 -28 | 381 -2 |
| 2020-21 | 3,492 -87 | 3,027 -80 | 1,095 -11 | 1,932 -69 | 465 -7 | 109 18 | 356 -25 |
| 2021-22 | 3,454 -38 | 2,979 -48 | 1,072 -23 | 1,907 -25 | 475 10 | 110 1 | 365 9 |
| 2022-23 | 3,483 29 | 2,985 6 | 1,134 62 | 1,851 -56 | 498 23 | 100 -10 | 398 33 |
| Average | 3,898 | 3,412 | 1,199 | 2,213 | 486 | 115 | 371 |