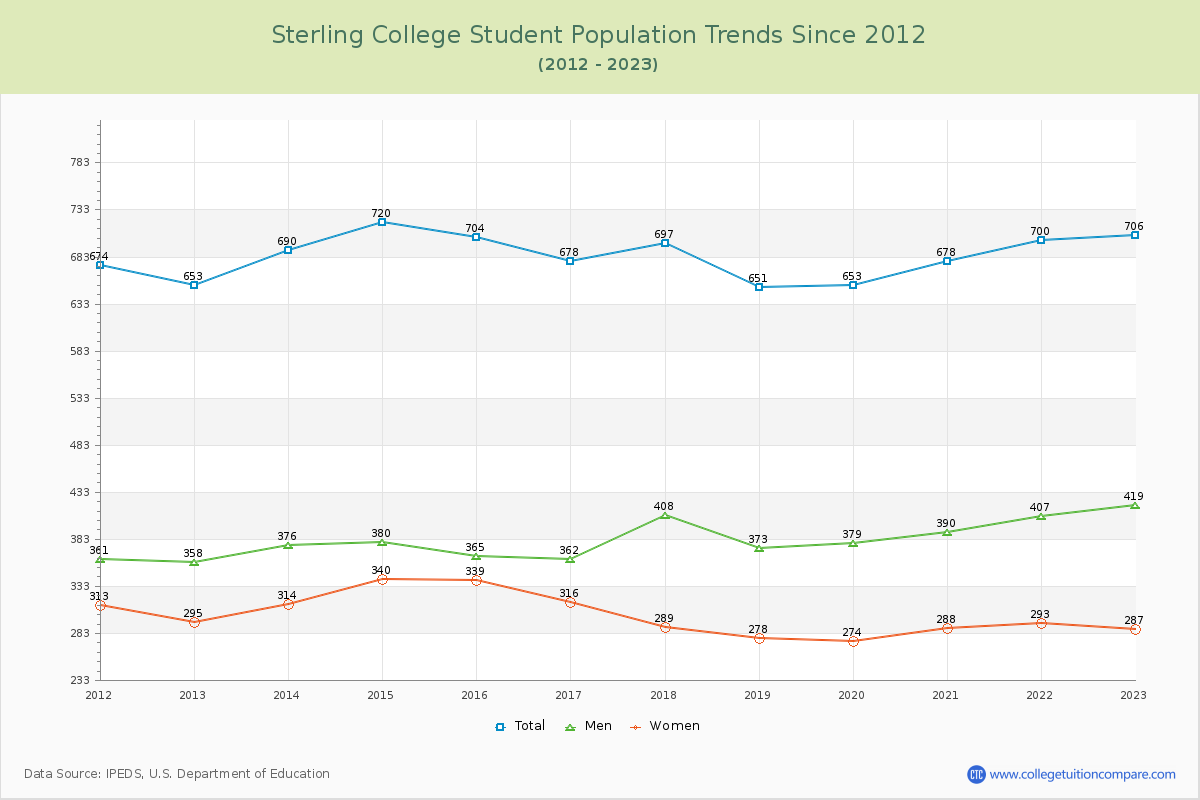
Student Population Changes
The average student population over the last 12 years is 685 where 706 students are attending the school for the academic year 2022-2023.
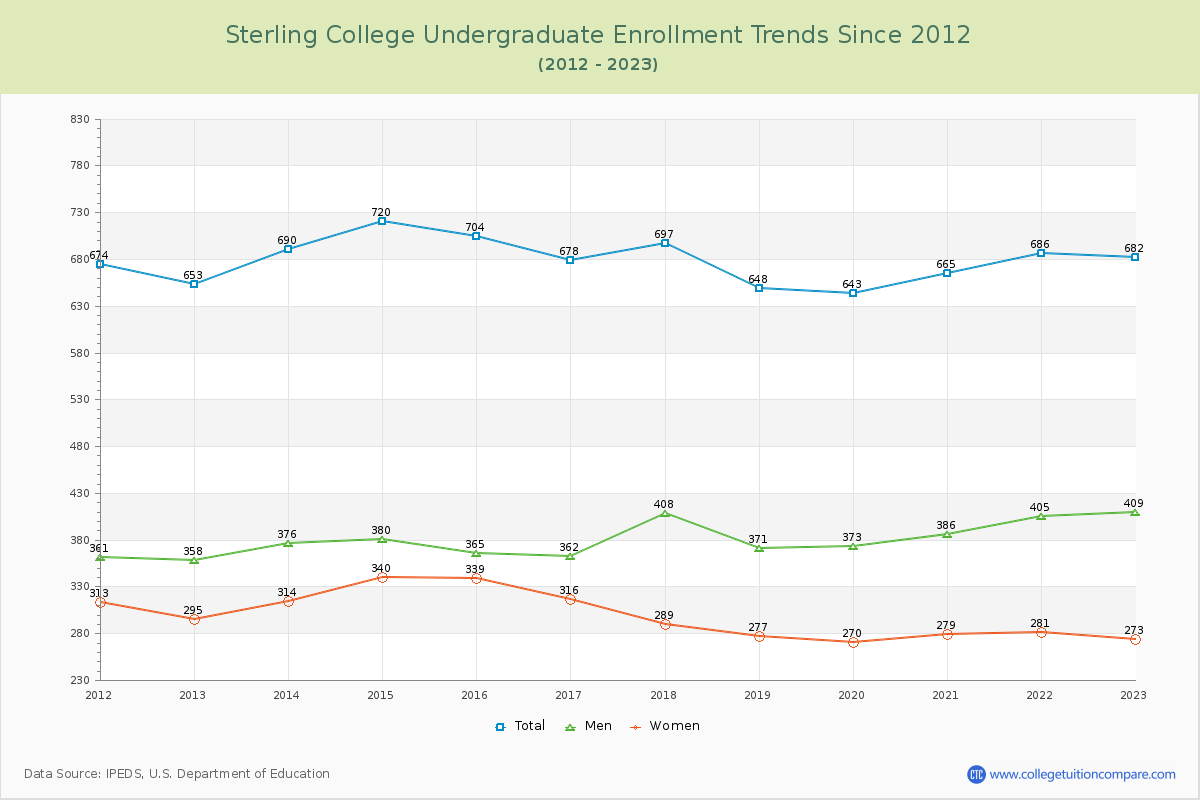
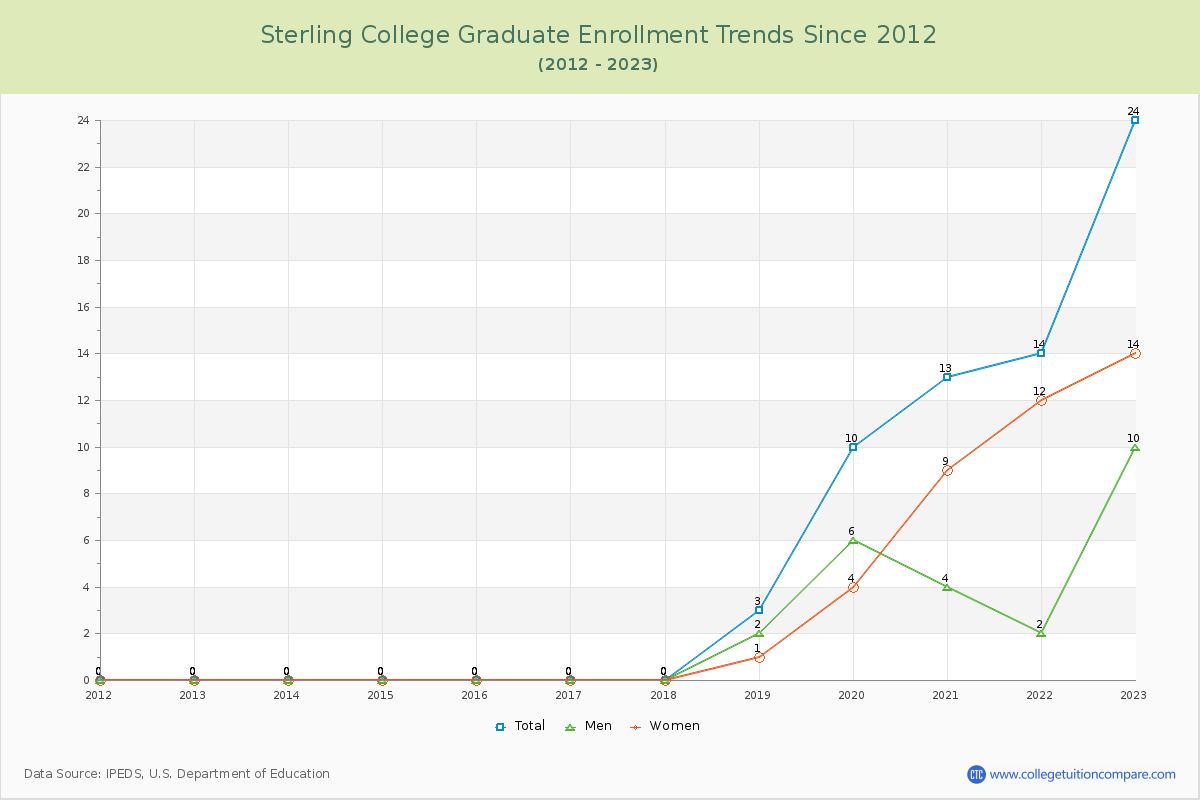
96.60% of total students is undergraduate students and 3.40% students is graduate students. The number of undergraduate students has increased by 29 and the graduate enrollment has increased by 24 over past 10 years.
The female to male ratio is 0.68 to 1 and it means that there are more male students enrolled in SC than female students.
The following table and chart illustrate the changes in student population by gender at Sterling College since 2012.
| Year | Total | Undergraduate | Graduate | ||||
|---|---|---|---|---|---|---|---|
| Total | Men | Women | Total | Men | Women | ||
| 2012-13 | 653 | 653 | 358 | 295 | 0 | 0 | 0 |
| 2013-14 | 690 37 | 690 37 | 376 18 | 314 19 | 0 0 | 0 0 | 0 0 |
| 2014-15 | 720 30 | 720 30 | 380 4 | 340 26 | 0 0 | 0 0 | 0 0 |
| 2015-16 | 704 -16 | 704 -16 | 365 -15 | 339 -1 | 0 0 | 0 0 | 0 0 |
| 2016-17 | 678 -26 | 678 -26 | 362 -3 | 316 -23 | 0 0 | 0 0 | 0 0 |
| 2017-18 | 697 19 | 697 19 | 408 46 | 289 -27 | 0 0 | 0 0 | 0 0 |
| 2018-19 | 651 -46 | 648 -49 | 371 -37 | 277 -12 | 3 3 | 2 2 | 1 1 |
| 2019-20 | 653 2 | 643 -5 | 373 2 | 270 -7 | 10 7 | 6 4 | 4 3 |
| 2020-21 | 678 25 | 665 22 | 386 13 | 279 9 | 13 3 | 4 -2 | 9 5 |
| 2021-22 | 700 22 | 686 21 | 405 19 | 281 2 | 14 1 | 2 -2 | 12 3 |
| 2022-23 | 706 6 | 682 -4 | 409 4 | 273 -8 | 24 10 | 10 8 | 14 2 |
| Average | 685 | 679 | 381 | 298 | 6 | 2 | 4 |