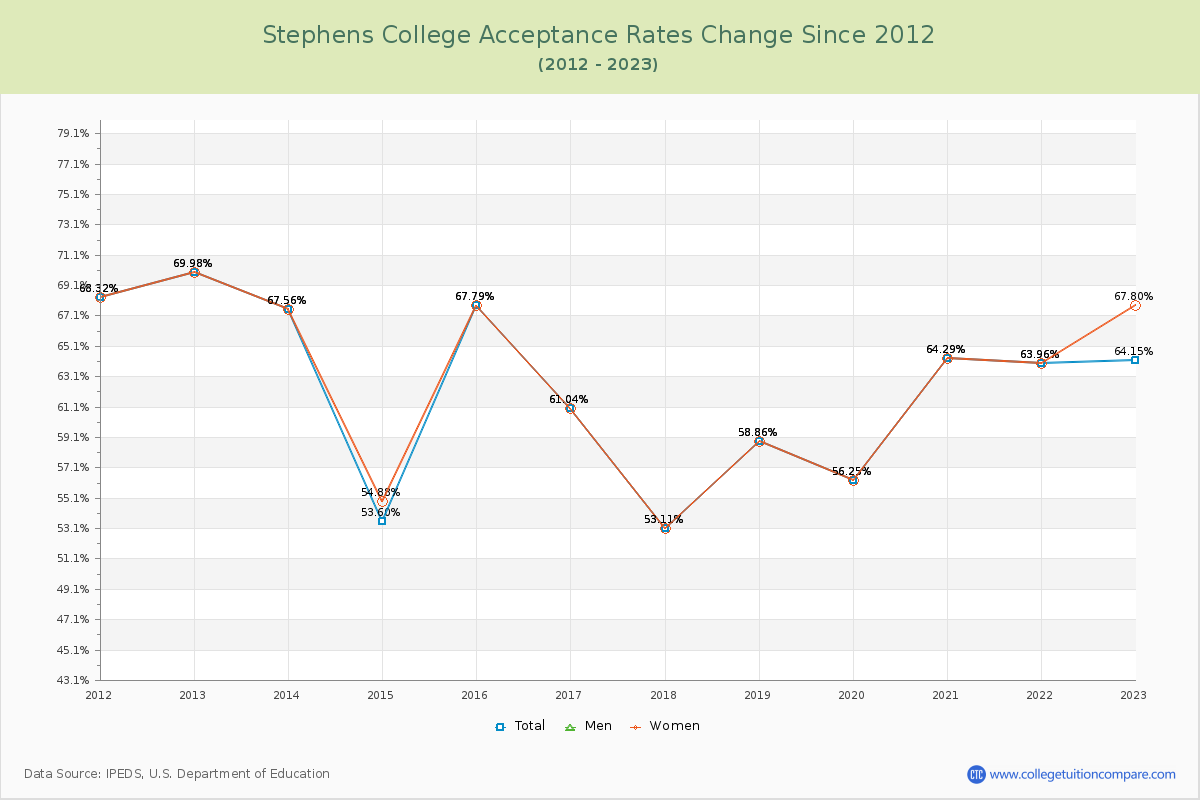
Acceptance Rate Changes
The average acceptance rate over the last 10 years is 61.87%, and this year's acceptance rate is 64.15% at Stephens College. By gender, men students' acceptance rate is 2.77% and women students' rate is 62.32%.
The next table and chart illustrate the acceptance rates changes at Stephens College over the past 11 years (2012-2023).
| Year | Total | Men | Women |
|---|---|---|---|
| 2012-13 | 69.98% | 0.00% | 69.98% |
| 2013-14 | 67.56% -2.42% |
0.00% -2.42% |
67.56% -2.42% |
| 2014-15 | 53.60% -13.96% |
0.00% -12.68% |
54.88% -12.68% |
| 2015-16 | 67.79% 14.19% |
0.00% 12.90% |
67.79% 12.90% |
| 2016-17 | 61.04% -6.74% |
0.00% -6.74% |
61.04% -6.74% |
| 2017-18 | 53.11% -7.93% |
0.00% -7.93% |
53.11% -7.93% |
| 2018-19 | 58.86% 5.75% |
0.00% 5.75% |
58.86% 5.75% |
| 2019-20 | 56.25% -2.61% |
0.00% -2.61% |
56.25% -2.61% |
| 2020-21 | 64.29% 8.04% |
0.00% 8.04% |
64.29% 8.04% |
| 2021-22 | 63.96% -0.33% |
0.00% -0.33% |
63.96% -0.33% |
| 2022-23 | 64.15% 0.20% |
30.43% 3.84% |
67.80% 3.84% |
| Average | 61.87% | 2.77% | 62.32% |