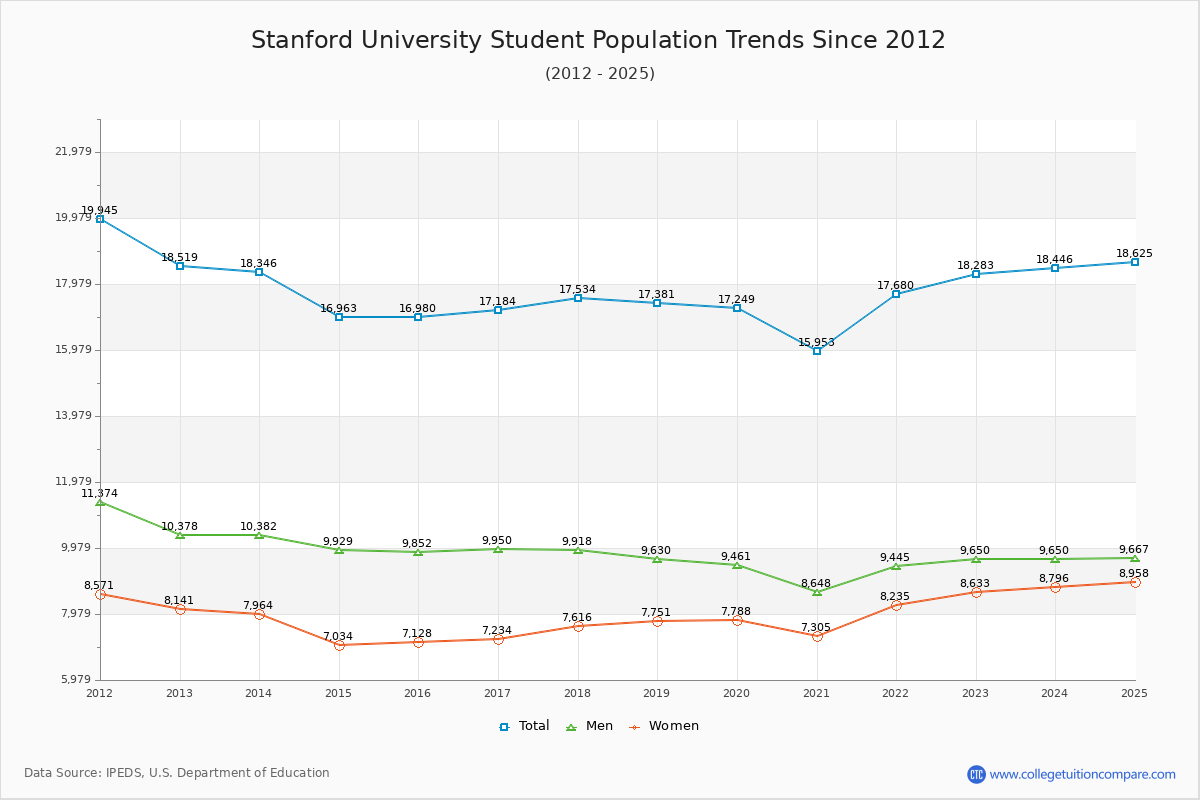
Student Population Changes
The average student population over the last 12 years is 17,461 where 18,283 students are attending the school for the academic year 2022-2023.
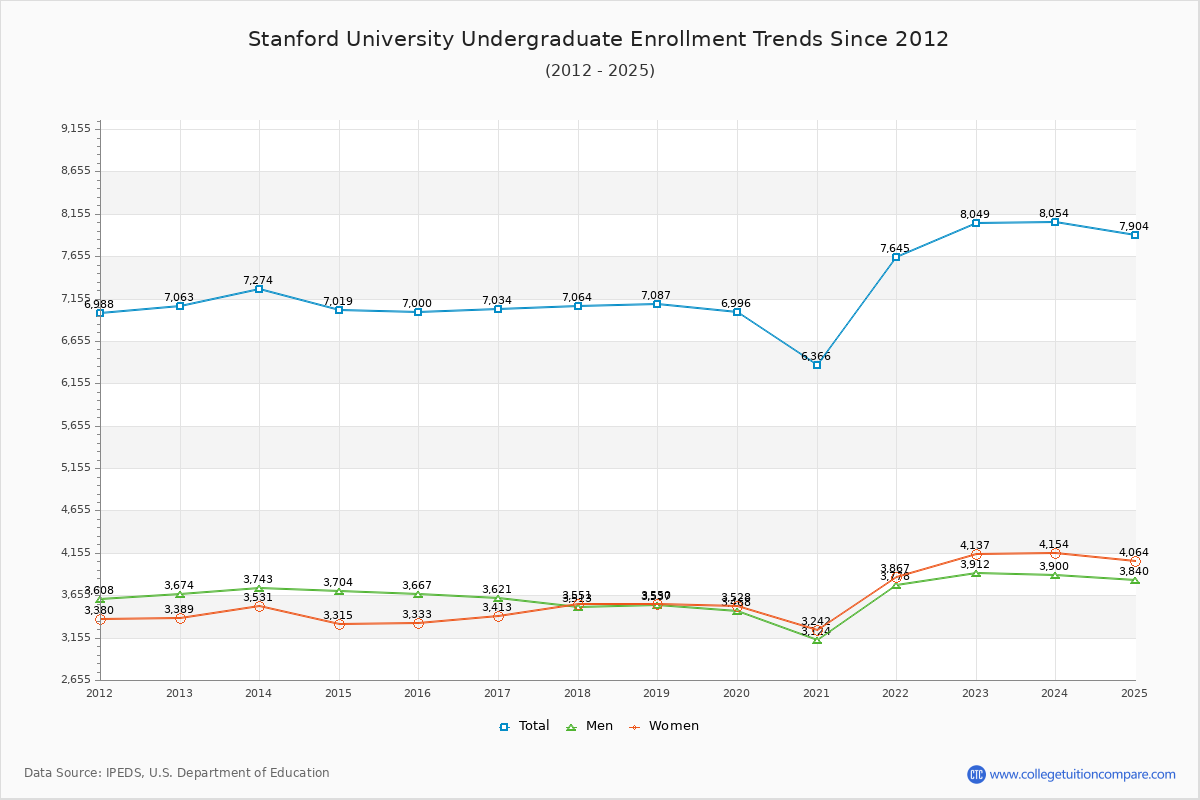
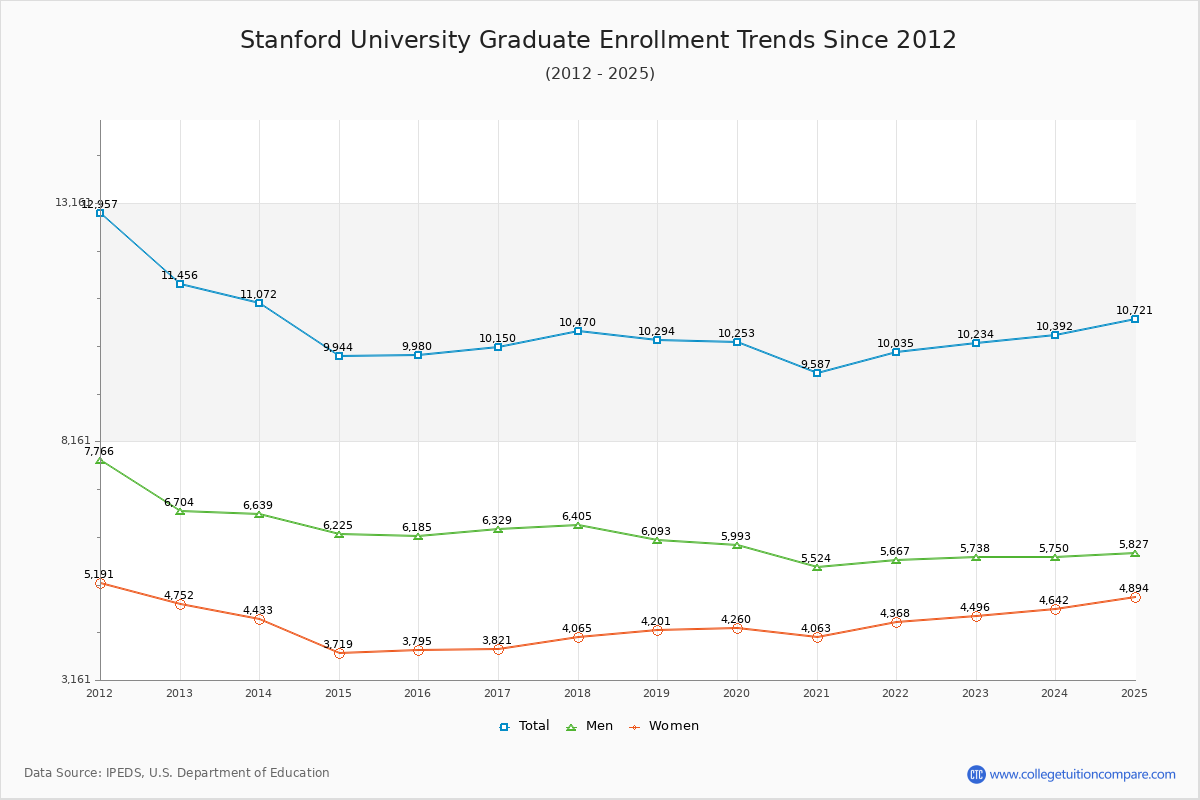
44.02% of total students is undergraduate students and 55.98% students is graduate students. The number of undergraduate students has increased by 986 and the graduate enrollment has decreased by 1,222 over past 10 years.
The female to male ratio is 0.89 to 1 and it means that there are slightly more male students enrolled in Stanford than female students.
The following table and chart illustrate the changes in student population by gender at Stanford University since 2012.
| Year | Total | Undergraduate | Graduate | ||||
|---|---|---|---|---|---|---|---|
| Total | Men | Women | Total | Men | Women | ||
| 2012-13 | 18,519 | 7,063 | 3,674 | 3,389 | 11,456 | 6,704 | 4,752 |
| 2013-14 | 18,346 -173 | 7,274 211 | 3,743 69 | 3,531 142 | 11,072 -384 | 6,639 -65 | 4,433 -319 |
| 2014-15 | 16,963 -1,383 | 7,019 -255 | 3,704 -39 | 3,315 -216 | 9,944 -1,128 | 6,225 -414 | 3,719 -714 |
| 2015-16 | 16,980 17 | 7,000 -19 | 3,667 -37 | 3,333 18 | 9,980 36 | 6,185 -40 | 3,795 76 |
| 2016-17 | 17,184 204 | 7,034 34 | 3,621 -46 | 3,413 80 | 10,150 170 | 6,329 144 | 3,821 26 |
| 2017-18 | 17,534 350 | 7,064 30 | 3,513 -108 | 3,551 138 | 10,470 320 | 6,405 76 | 4,065 244 |
| 2018-19 | 17,381 -153 | 7,087 23 | 3,537 24 | 3,550 -1 | 10,294 -176 | 6,093 -312 | 4,201 136 |
| 2019-20 | 17,249 -132 | 6,996 -91 | 3,468 -69 | 3,528 -22 | 10,253 -41 | 5,993 -100 | 4,260 59 |
| 2020-21 | 15,953 -1,296 | 6,366 -630 | 3,124 -344 | 3,242 -286 | 9,587 -666 | 5,524 -469 | 4,063 -197 |
| 2021-22 | 17,680 1,727 | 7,645 1,279 | 3,778 654 | 3,867 625 | 10,035 448 | 5,667 143 | 4,368 305 |
| 2022-23 | 18,283 603 | 8,049 404 | 3,912 134 | 4,137 270 | 10,234 199 | 5,738 71 | 4,496 128 |
| Average | 17,461 | 7,145 | 3,613 | 3,532 | 10,316 | 6,137 | 4,179 |