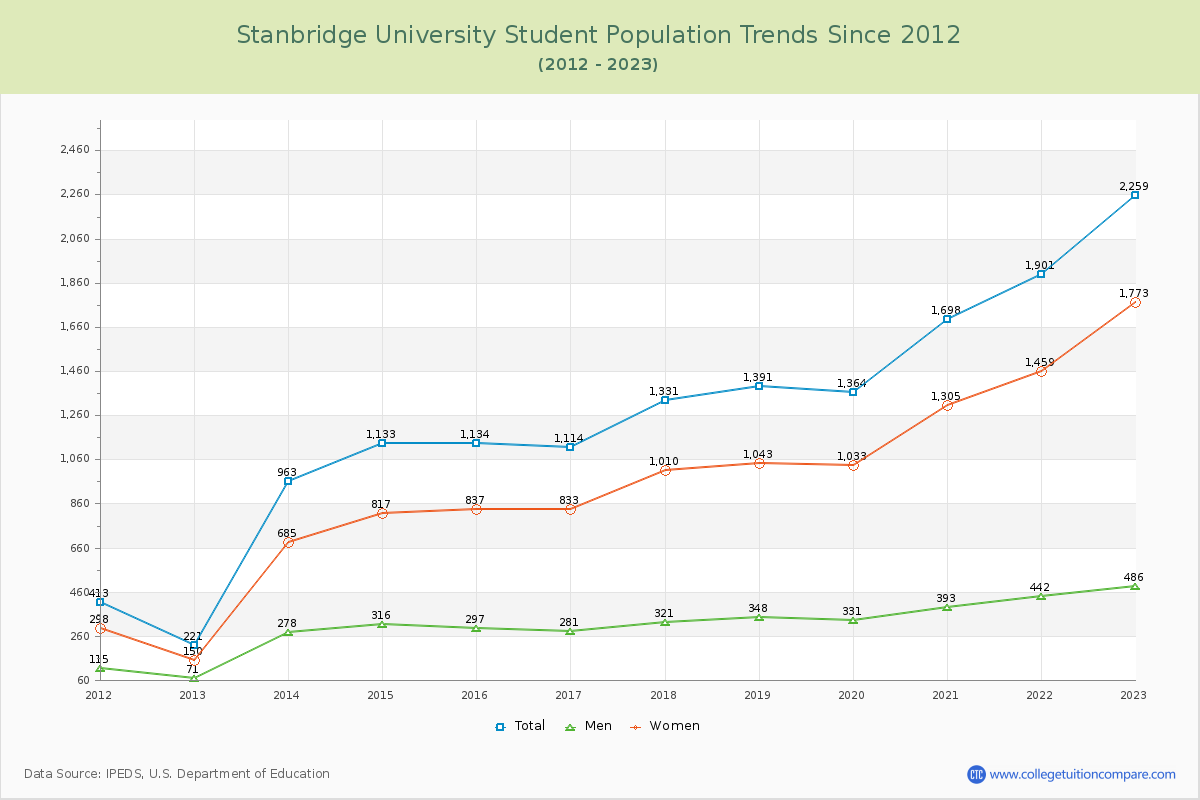
Student Population Changes
The average student population over the last 12 years is 1,319 where 2,259 students are attending the school for the academic year 2022-2023.
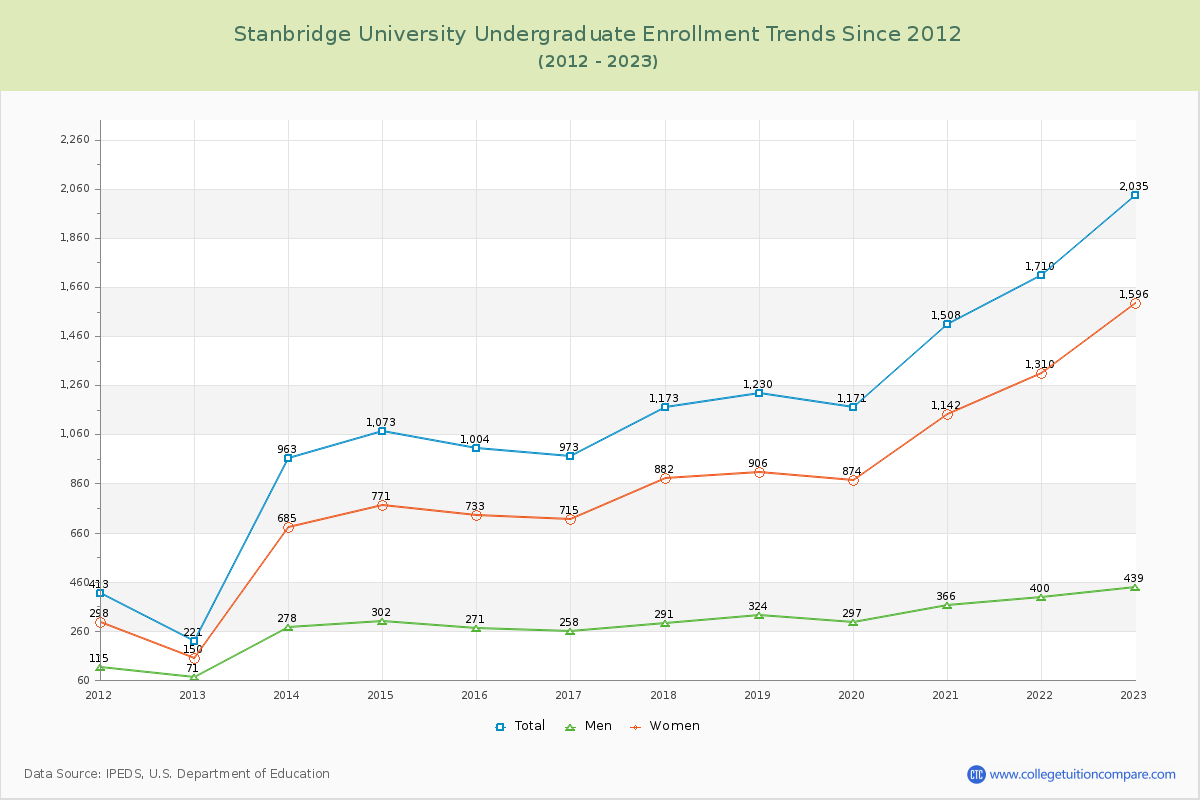
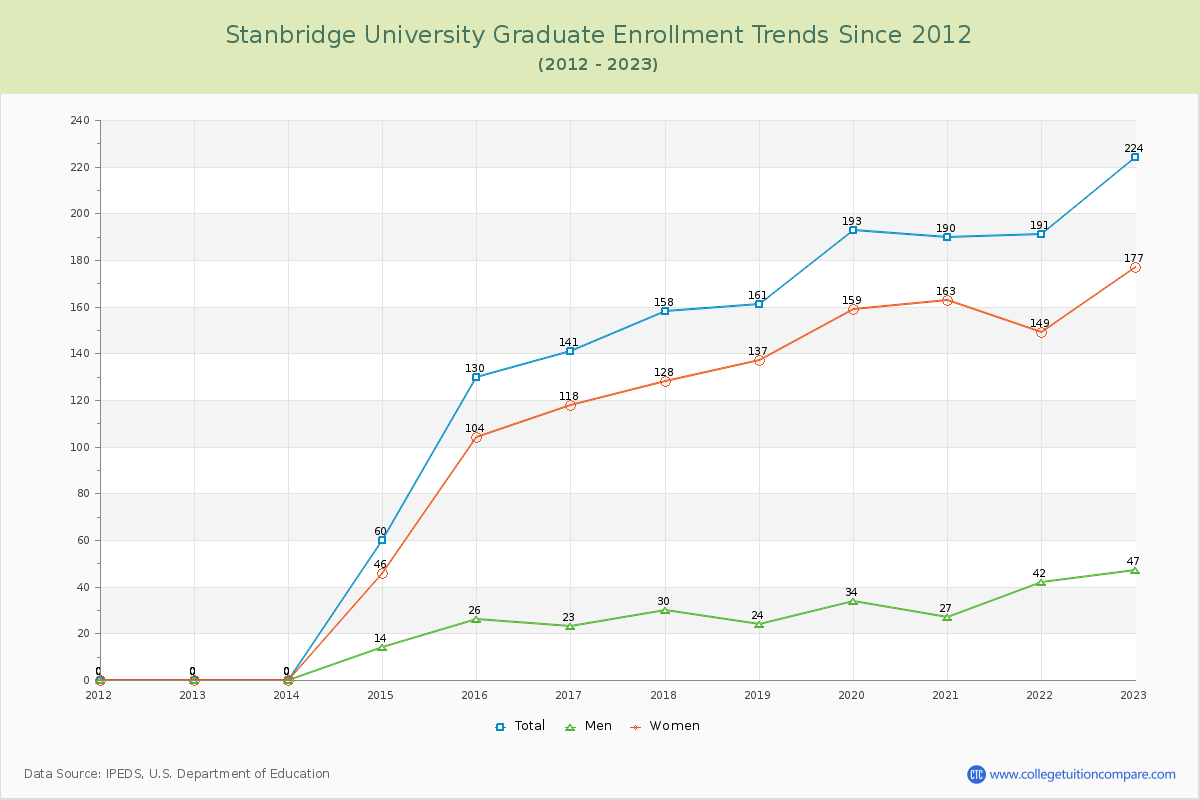
90.08% of total students is undergraduate students and 9.92% students is graduate students. The number of undergraduate students has increased by 1,814 and the graduate enrollment has increased by 224 over past 10 years.
The female to male ratio is 3.65 to 1 and it means that there are far more female students enrolled in Stanbridge than male students.
The following table and chart illustrate the changes in student population by gender at Stanbridge University since 2012.
| Year | Total | Undergraduate | Graduate | ||||
|---|---|---|---|---|---|---|---|
| Total | Men | Women | Total | Men | Women | ||
| 2012-13 | 221 | 221 | 71 | 150 | 0 | 0 | 0 |
| 2013-14 | 963 742 | 963 742 | 278 207 | 685 535 | 0 0 | 0 0 | 0 0 |
| 2014-15 | 1,133 170 | 1,073 110 | 302 24 | 771 86 | 60 60 | 14 14 | 46 46 |
| 2015-16 | 1,134 1 | 1,004 -69 | 271 -31 | 733 -38 | 130 70 | 26 12 | 104 58 |
| 2016-17 | 1,114 -20 | 973 -31 | 258 -13 | 715 -18 | 141 11 | 23 -3 | 118 14 |
| 2017-18 | 1,331 217 | 1,173 200 | 291 33 | 882 167 | 158 17 | 30 7 | 128 10 |
| 2018-19 | 1,391 60 | 1,230 57 | 324 33 | 906 24 | 161 3 | 24 -6 | 137 9 |
| 2019-20 | 1,364 -27 | 1,171 -59 | 297 -27 | 874 -32 | 193 32 | 34 10 | 159 22 |
| 2020-21 | 1,698 334 | 1,508 337 | 366 69 | 1,142 268 | 190 -3 | 27 -7 | 163 4 |
| 2021-22 | 1,901 203 | 1,710 202 | 400 34 | 1,310 168 | 191 1 | 42 15 | 149 -14 |
| 2022-23 | 2,259 358 | 2,035 325 | 439 39 | 1,596 286 | 224 33 | 47 5 | 177 28 |
| Average | 1,319 | 1,187 | 300 | 888 | 132 | 24 | 107 |