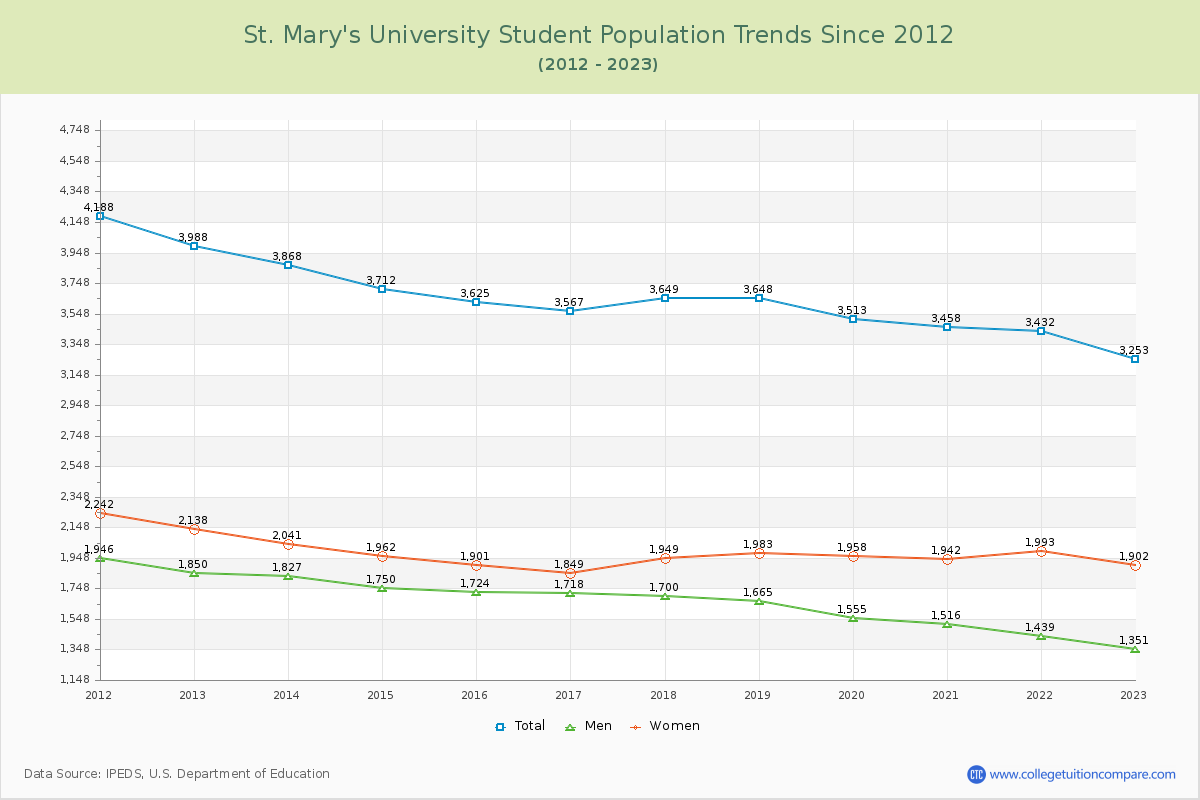
Student Population Changes
The average student population over the last 12 years is 3,610 where 3,253 students are attending the school for the academic year 2022-2023.
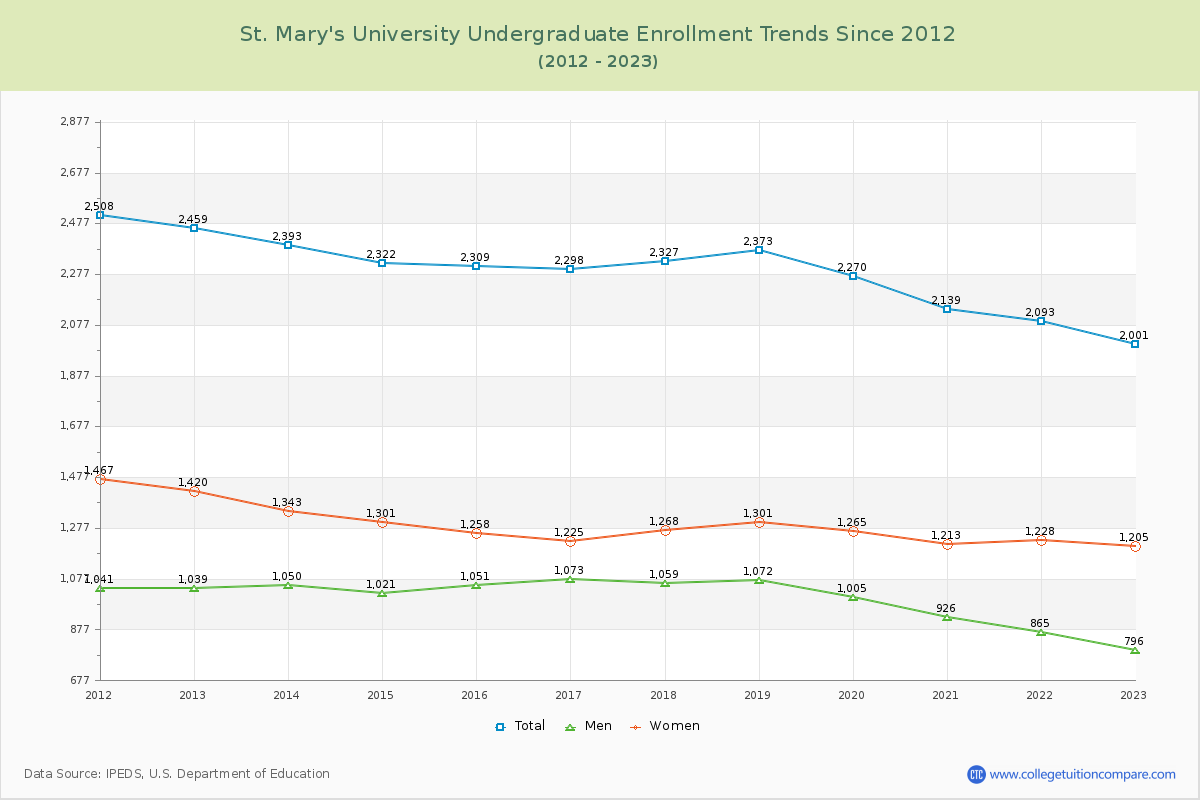
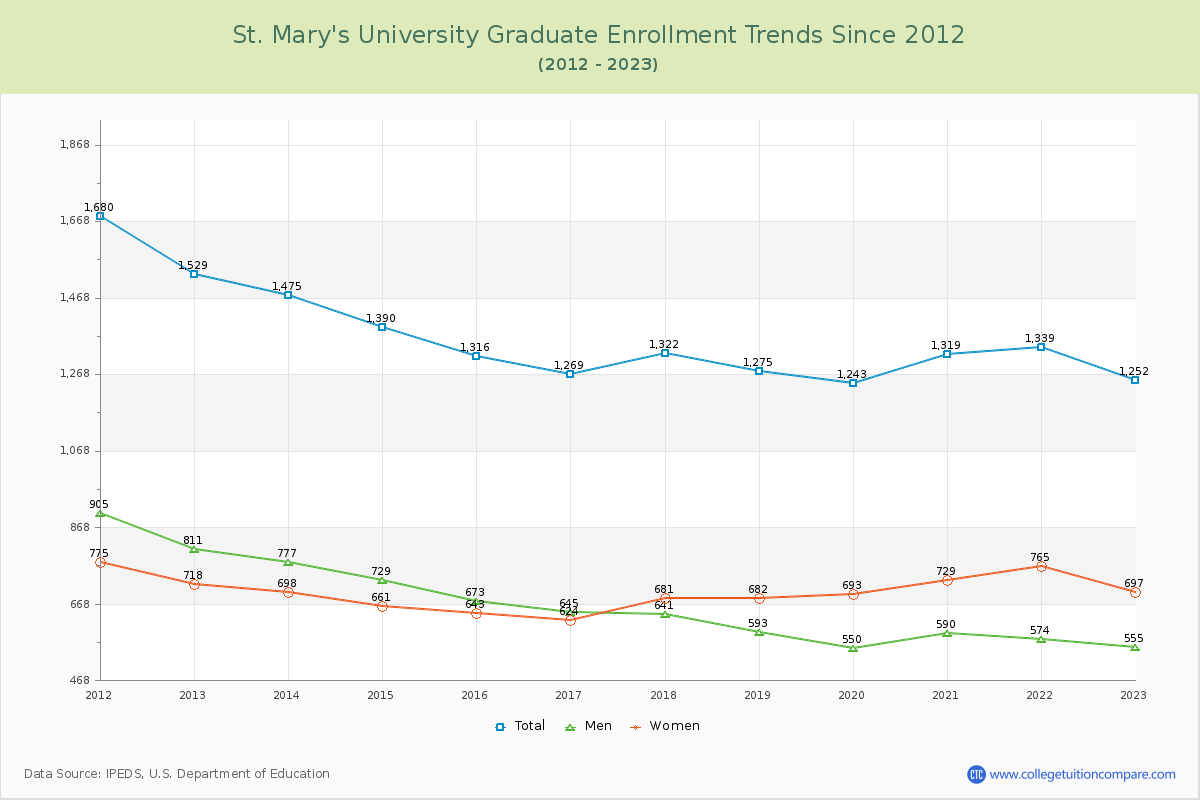
61.51% of total students is undergraduate students and 38.49% students is graduate students. The number of undergraduate students has decreased by 458 and the graduate enrollment has decreased by 277 over past 10 years.
The female to male ratio is 1.41 to 1 and it means that there are more female students enrolled in St. Mary's than male students.
The following table and chart illustrate the changes in student population by gender at St. Mary's University since 2012.
| Year | Total | Undergraduate | Graduate | ||||
|---|---|---|---|---|---|---|---|
| Total | Men | Women | Total | Men | Women | ||
| 2012-13 | 3,988 | 2,459 | 1,039 | 1,420 | 1,529 | 811 | 718 |
| 2013-14 | 3,868 -120 | 2,393 -66 | 1,050 11 | 1,343 -77 | 1,475 -54 | 777 -34 | 698 -20 |
| 2014-15 | 3,712 -156 | 2,322 -71 | 1,021 -29 | 1,301 -42 | 1,390 -85 | 729 -48 | 661 -37 |
| 2015-16 | 3,625 -87 | 2,309 -13 | 1,051 30 | 1,258 -43 | 1,316 -74 | 673 -56 | 643 -18 |
| 2016-17 | 3,567 -58 | 2,298 -11 | 1,073 22 | 1,225 -33 | 1,269 -47 | 645 -28 | 624 -19 |
| 2017-18 | 3,649 82 | 2,327 29 | 1,059 -14 | 1,268 43 | 1,322 53 | 641 -4 | 681 57 |
| 2018-19 | 3,648 -1 | 2,373 46 | 1,072 13 | 1,301 33 | 1,275 -47 | 593 -48 | 682 1 |
| 2019-20 | 3,513 -135 | 2,270 -103 | 1,005 -67 | 1,265 -36 | 1,243 -32 | 550 -43 | 693 11 |
| 2020-21 | 3,458 -55 | 2,139 -131 | 926 -79 | 1,213 -52 | 1,319 76 | 590 40 | 729 36 |
| 2021-22 | 3,432 -26 | 2,093 -46 | 865 -61 | 1,228 15 | 1,339 20 | 574 -16 | 765 36 |
| 2022-23 | 3,253 -179 | 2,001 -92 | 796 -69 | 1,205 -23 | 1,252 -87 | 555 -19 | 697 -68 |
| Average | 3,610 | 2,271 | 996 | 1,275 | 1,339 | 649 | 690 |