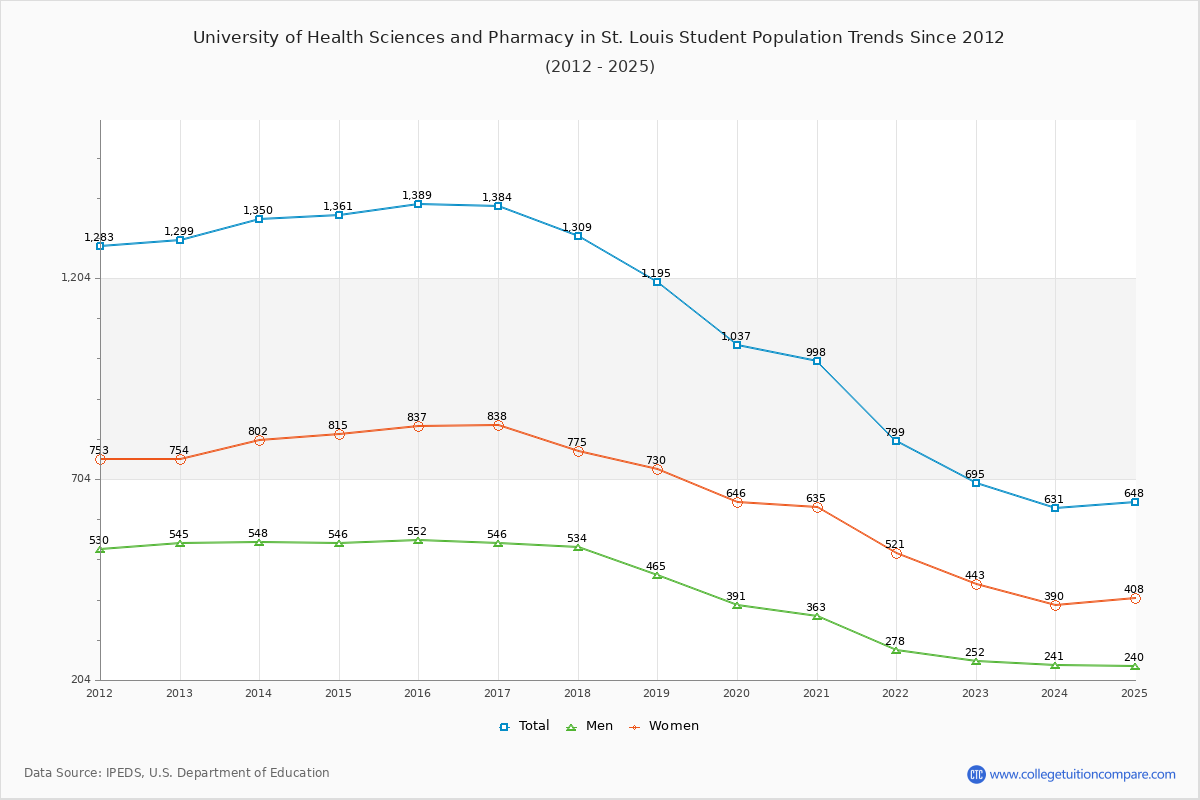
Student Population Changes
The average student population over the last 12 years is 1,165 where 695 students are attending the school for the academic year 2022-2023.
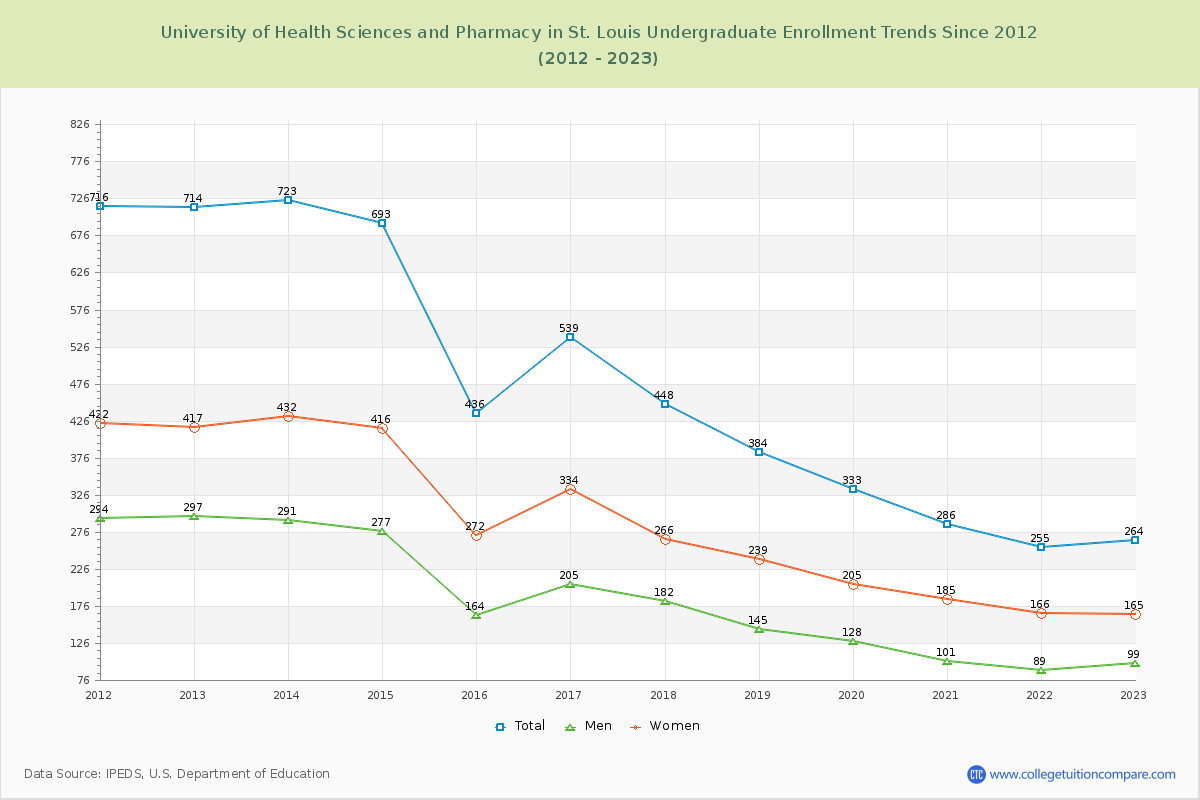
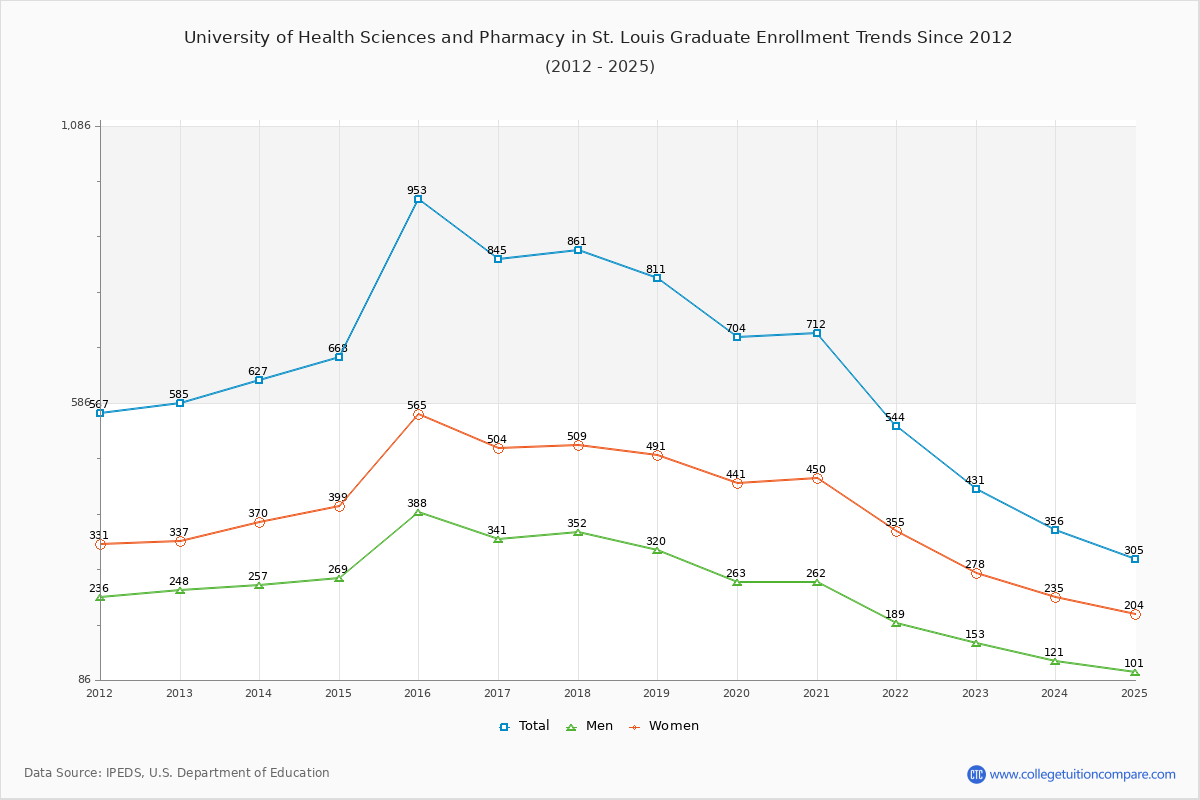
37.99% of total students is undergraduate students and 62.01% students is graduate students. The number of undergraduate students has decreased by 450 and the graduate enrollment has decreased by 154 over past 10 years.
The female to male ratio is 1.76 to 1 and it means that there are more female students enrolled in U of Health Sciences and Pharmacy in St. Louis than male students.
The following table and chart illustrate the changes in student population by gender at University of Health Sciences and Pharmacy in St. Louis since 2012.
| Year | Total | Undergraduate | Graduate | ||||
|---|---|---|---|---|---|---|---|
| Total | Men | Women | Total | Men | Women | ||
| 2012-13 | 1,299 | 714 | 297 | 417 | 585 | 248 | 337 |
| 2013-14 | 1,350 51 | 723 9 | 291 -6 | 432 15 | 627 42 | 257 9 | 370 33 |
| 2014-15 | 1,361 11 | 693 -30 | 277 -14 | 416 -16 | 668 41 | 269 12 | 399 29 |
| 2015-16 | 1,389 28 | 436 -257 | 164 -113 | 272 -144 | 953 285 | 388 119 | 565 166 |
| 2016-17 | 1,384 -5 | 539 103 | 205 41 | 334 62 | 845 -108 | 341 -47 | 504 -61 |
| 2017-18 | 1,309 -75 | 448 -91 | 182 -23 | 266 -68 | 861 16 | 352 11 | 509 5 |
| 2018-19 | 1,195 -114 | 384 -64 | 145 -37 | 239 -27 | 811 -50 | 320 -32 | 491 -18 |
| 2019-20 | 1,037 -158 | 333 -51 | 128 -17 | 205 -34 | 704 -107 | 263 -57 | 441 -50 |
| 2020-21 | 998 -39 | 286 -47 | 101 -27 | 185 -20 | 712 8 | 262 -1 | 450 9 |
| 2021-22 | 799 -199 | 255 -31 | 89 -12 | 166 -19 | 544 -168 | 189 -73 | 355 -95 |
| 2022-23 | 695 -104 | 264 9 | 99 10 | 165 -1 | 431 -113 | 153 -36 | 278 -77 |
| Average | 1,165 | 461 | 180 | 282 | 704 | 277 | 427 |