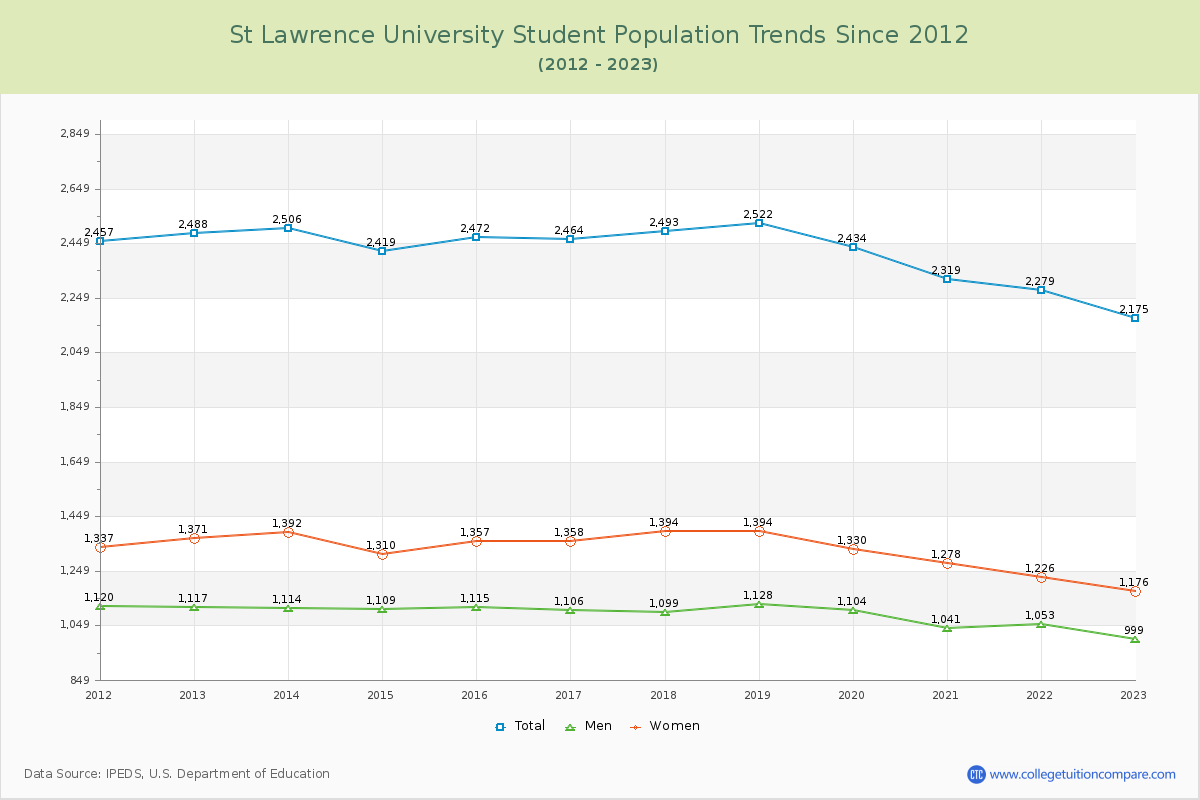
Student Population Changes
The average student population over the last 12 years is 2,416 where 2,175 students are attending the school for the academic year 2022-2023.
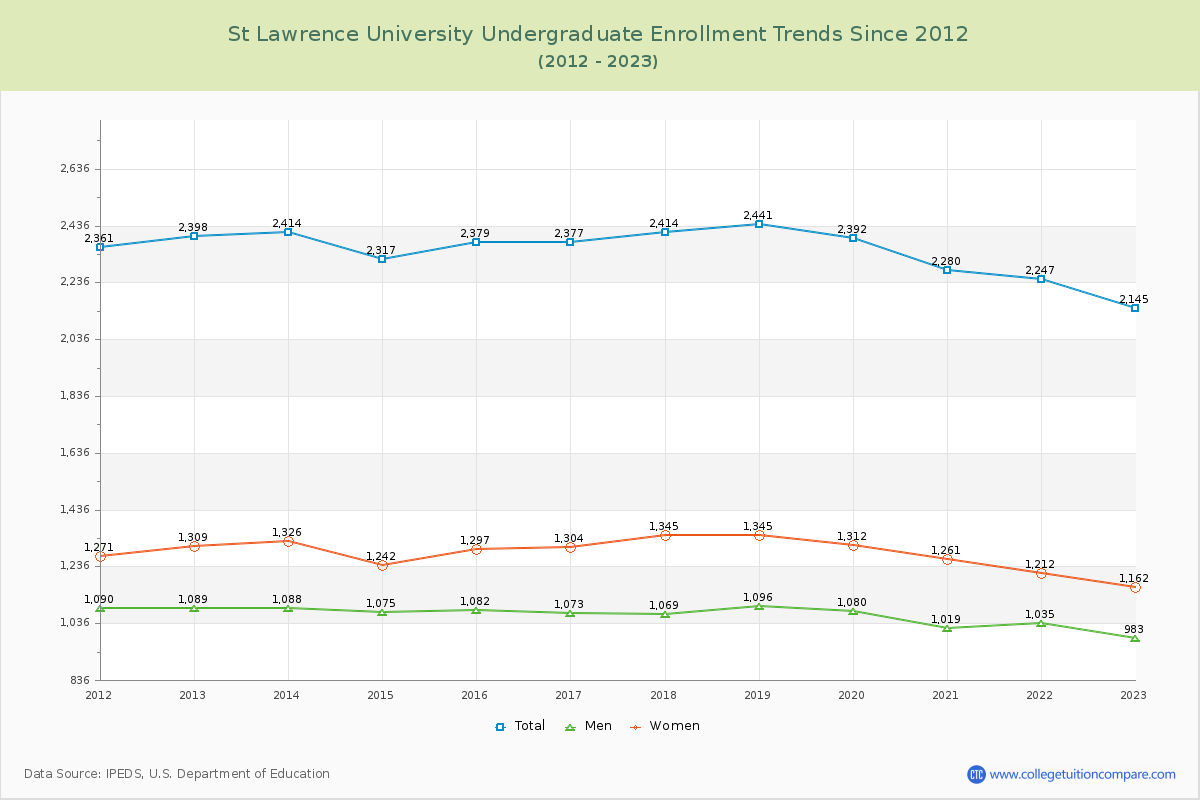
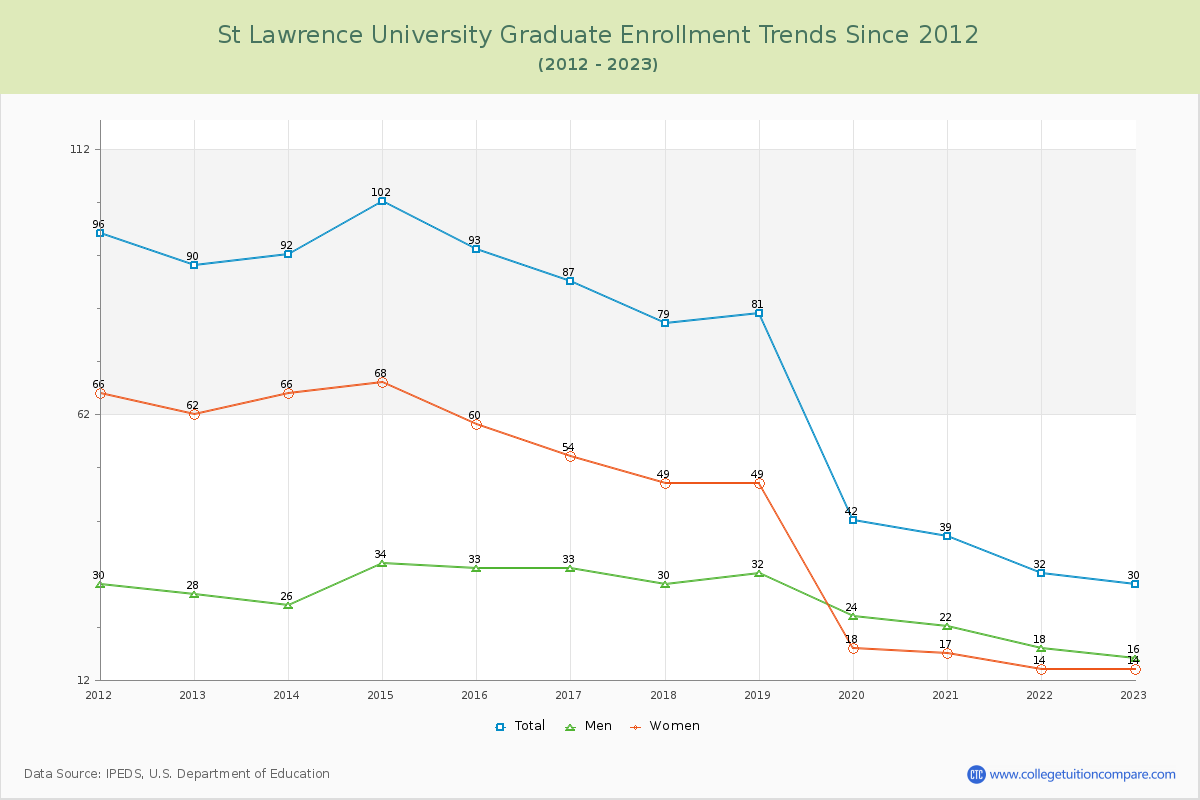
98.62% of total students is undergraduate students and 1.38% students is graduate students. The number of undergraduate students has decreased by 253 and the graduate enrollment has decreased by 60 over past 10 years.
The female to male ratio is 1.18 to 1 and it means that there are slightly more female students enrolled in St Lawrence than male students.
The following table and chart illustrate the changes in student population by gender at St Lawrence University since 2012.
| Year | Total | Undergraduate | Graduate | ||||
|---|---|---|---|---|---|---|---|
| Total | Men | Women | Total | Men | Women | ||
| 2012-13 | 2,488 | 2,398 | 1,089 | 1,309 | 90 | 28 | 62 |
| 2013-14 | 2,506 18 | 2,414 16 | 1,088 -1 | 1,326 17 | 92 2 | 26 -2 | 66 4 |
| 2014-15 | 2,419 -87 | 2,317 -97 | 1,075 -13 | 1,242 -84 | 102 10 | 34 8 | 68 2 |
| 2015-16 | 2,472 53 | 2,379 62 | 1,082 7 | 1,297 55 | 93 -9 | 33 -1 | 60 -8 |
| 2016-17 | 2,464 -8 | 2,377 -2 | 1,073 -9 | 1,304 7 | 87 -6 | 33 0 | 54 -6 |
| 2017-18 | 2,493 29 | 2,414 37 | 1,069 -4 | 1,345 41 | 79 -8 | 30 -3 | 49 -5 |
| 2018-19 | 2,522 29 | 2,441 27 | 1,096 27 | 1,345 0 | 81 2 | 32 2 | 49 0 |
| 2019-20 | 2,434 -88 | 2,392 -49 | 1,080 -16 | 1,312 -33 | 42 -39 | 24 -8 | 18 -31 |
| 2020-21 | 2,319 -115 | 2,280 -112 | 1,019 -61 | 1,261 -51 | 39 -3 | 22 -2 | 17 -1 |
| 2021-22 | 2,279 -40 | 2,247 -33 | 1,035 16 | 1,212 -49 | 32 -7 | 18 -4 | 14 -3 |
| 2022-23 | 2,175 -104 | 2,145 -102 | 983 -52 | 1,162 -50 | 30 -2 | 16 -2 | 14 0 |
| Average | 2,416 | 2,346 | 1,063 | 1,283 | 70 | 27 | 43 |