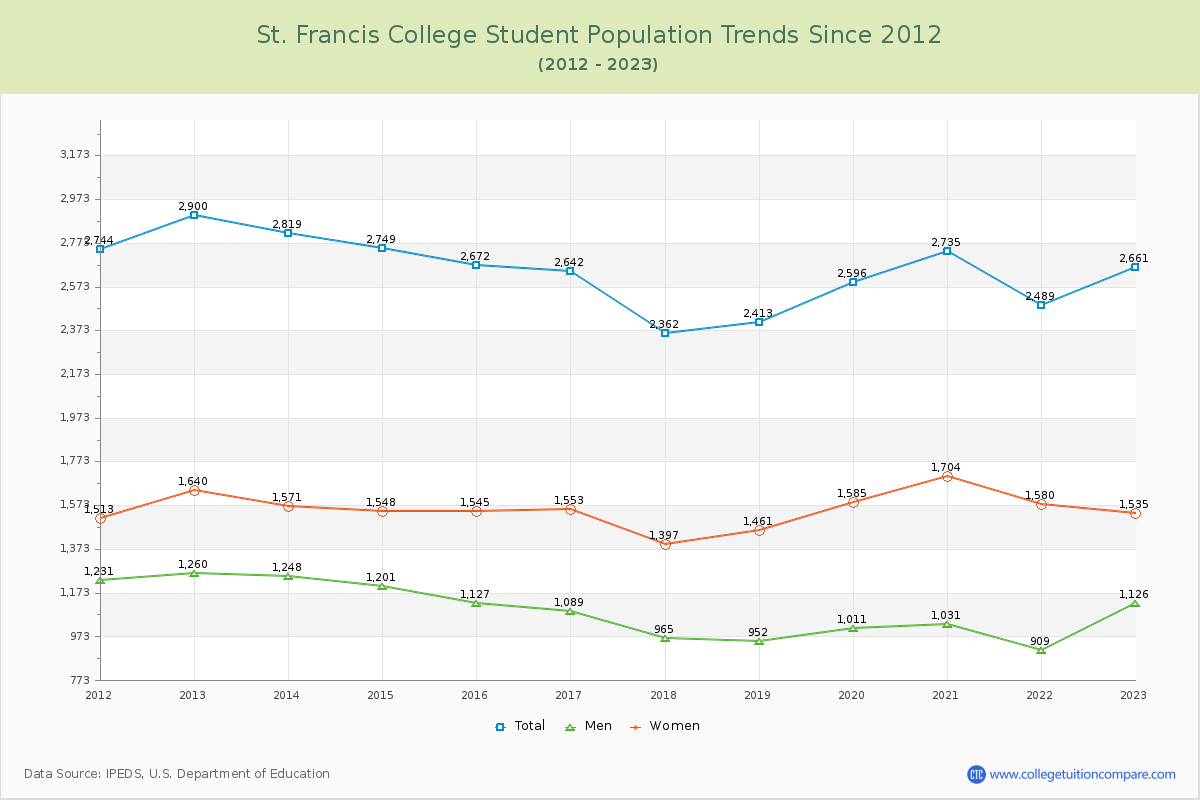
Student Population Changes
The average student population over the last 12 years is 2,640 where 2,661 students are attending the school for the academic year 2022-2023.
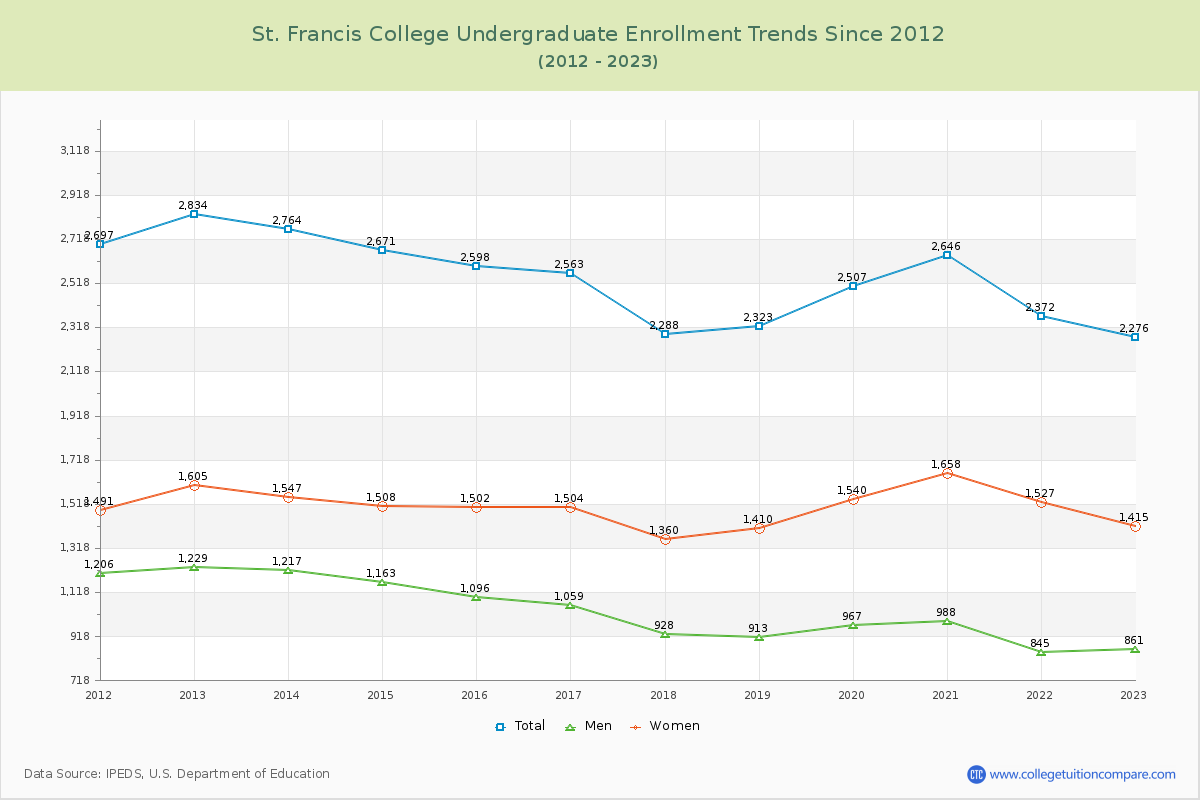
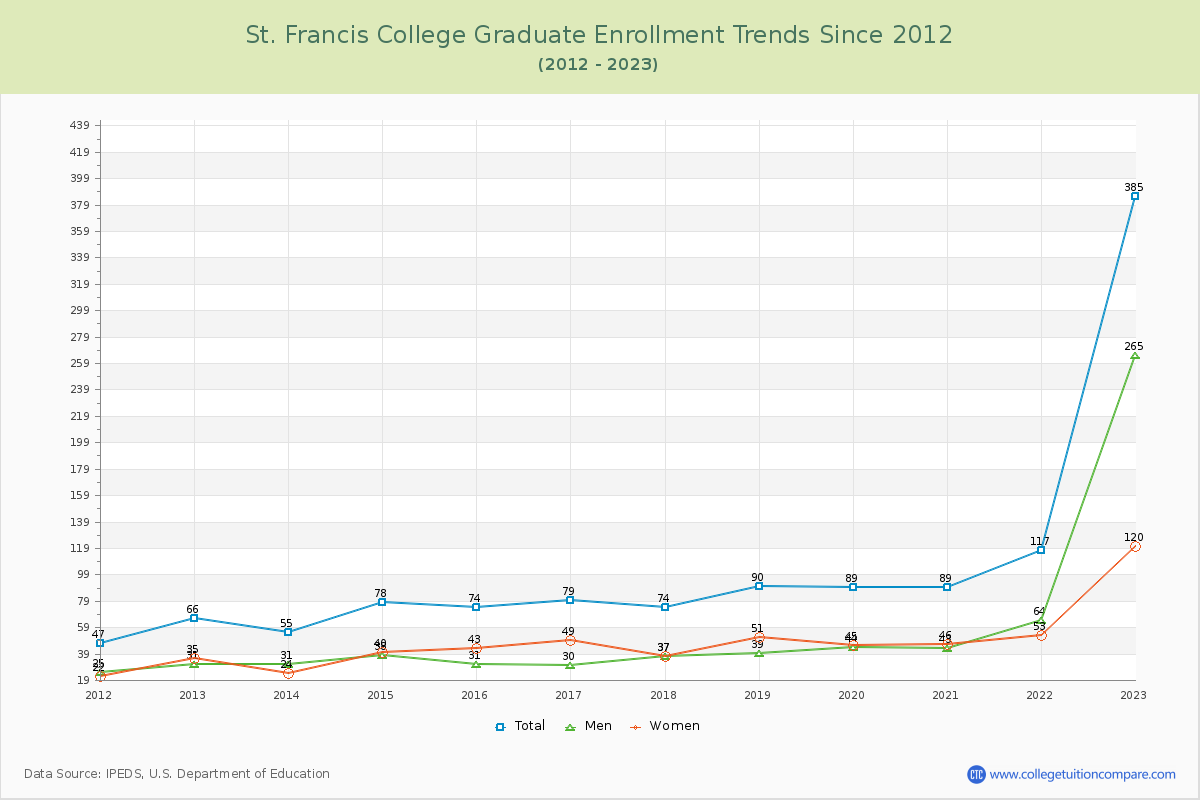
85.53% of total students is undergraduate students and 14.47% students is graduate students. The number of undergraduate students has decreased by 558 and the graduate enrollment has increased by 319 over past 10 years.
The female to male ratio is 1.36 to 1 and it means that there are more female students enrolled in SFC than male students.
The following table and chart illustrate the changes in student population by gender at St. Francis College since 2012.
| Year | Total | Undergraduate | Graduate | ||||
|---|---|---|---|---|---|---|---|
| Total | Men | Women | Total | Men | Women | ||
| 2012-13 | 2,900 | 2,834 | 1,229 | 1,605 | 66 | 31 | 35 |
| 2013-14 | 2,819 -81 | 2,764 -70 | 1,217 -12 | 1,547 -58 | 55 -11 | 31 0 | 24 -11 |
| 2014-15 | 2,749 -70 | 2,671 -93 | 1,163 -54 | 1,508 -39 | 78 23 | 38 7 | 40 16 |
| 2015-16 | 2,672 -77 | 2,598 -73 | 1,096 -67 | 1,502 -6 | 74 -4 | 31 -7 | 43 3 |
| 2016-17 | 2,642 -30 | 2,563 -35 | 1,059 -37 | 1,504 2 | 79 5 | 30 -1 | 49 6 |
| 2017-18 | 2,362 -280 | 2,288 -275 | 928 -131 | 1,360 -144 | 74 -5 | 37 7 | 37 -12 |
| 2018-19 | 2,413 51 | 2,323 35 | 913 -15 | 1,410 50 | 90 16 | 39 2 | 51 14 |
| 2019-20 | 2,596 183 | 2,507 184 | 967 54 | 1,540 130 | 89 -1 | 44 5 | 45 -6 |
| 2020-21 | 2,735 139 | 2,646 139 | 988 21 | 1,658 118 | 89 0 | 43 -1 | 46 1 |
| 2021-22 | 2,489 -246 | 2,372 -274 | 845 -143 | 1,527 -131 | 117 28 | 64 21 | 53 7 |
| 2022-23 | 2,661 172 | 2,276 -96 | 861 16 | 1,415 -112 | 385 268 | 265 201 | 120 67 |
| Average | 2,640 | 2,531 | 1,024 | 1,507 | 109 | 59 | 49 |