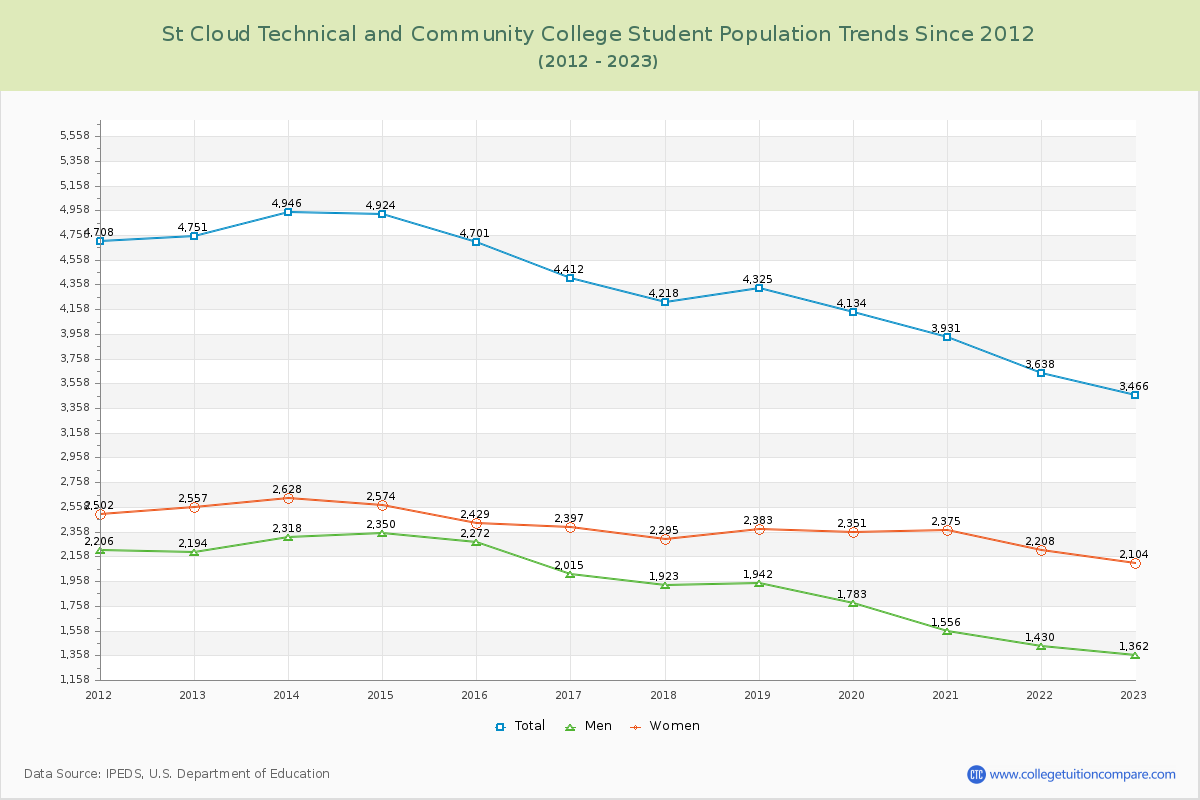
Student Population Changes
The average student population over the last 12 years is 4,313 where 3,466 students are attending the school for the academic year 2022-2023.
The female to male ratio is 1.54 to 1 and it means that there are more female students enrolled in St Cloud Technical and CC than male students.
The following table and chart illustrate the changes in student population by gender at St Cloud Technical and Community College since 2012.
| Year | Total | Men | Women |
|---|---|---|---|
| 2012-13 | 4,751 | 2,194 | 2,557 |
| 2013-14 | 4,946 195 | 2,318 124 | 2,628 71 |
| 2014-15 | 4,924 -22 | 2,350 32 | 2,574 -54 |
| 2015-16 | 4,701 -223 | 2,272 -78 | 2,429 -145 |
| 2016-17 | 4,412 -289 | 2,015 -257 | 2,397 -32 |
| 2017-18 | 4,218 -194 | 1,923 -92 | 2,295 -102 |
| 2018-19 | 4,325 107 | 1,942 19 | 2,383 88 |
| 2019-20 | 4,134 -191 | 1,783 -159 | 2,351 -32 |
| 2020-21 | 3,931 -203 | 1,556 -227 | 2,375 24 |
| 2021-22 | 3,638 -293 | 1,430 -126 | 2,208 -167 |
| 2022-23 | 3,466 -172 | 1,362 -68 | 2,104 -104 |
| Average | 4,313 | 1,922 | 2,391 |