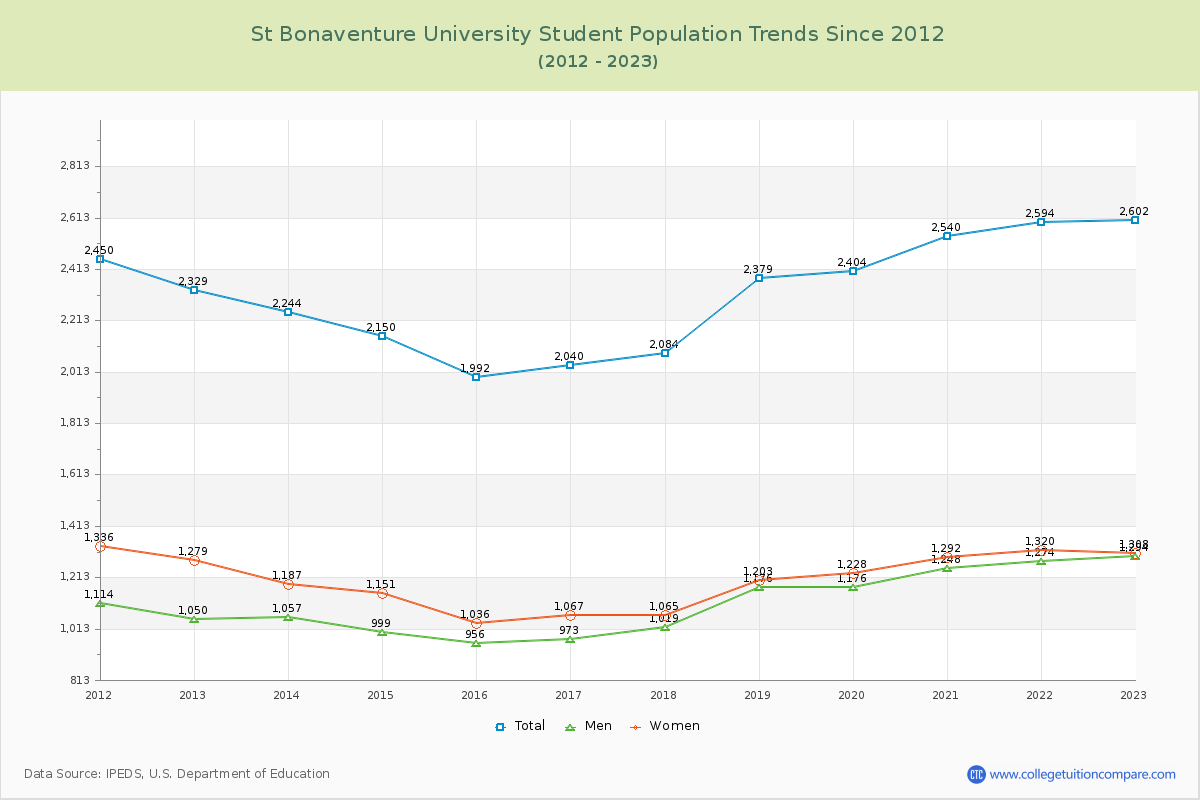
Student Population Changes
The average student population over the last 12 years is 2,305 where 2,602 students are attending the school for the academic year 2022-2023.
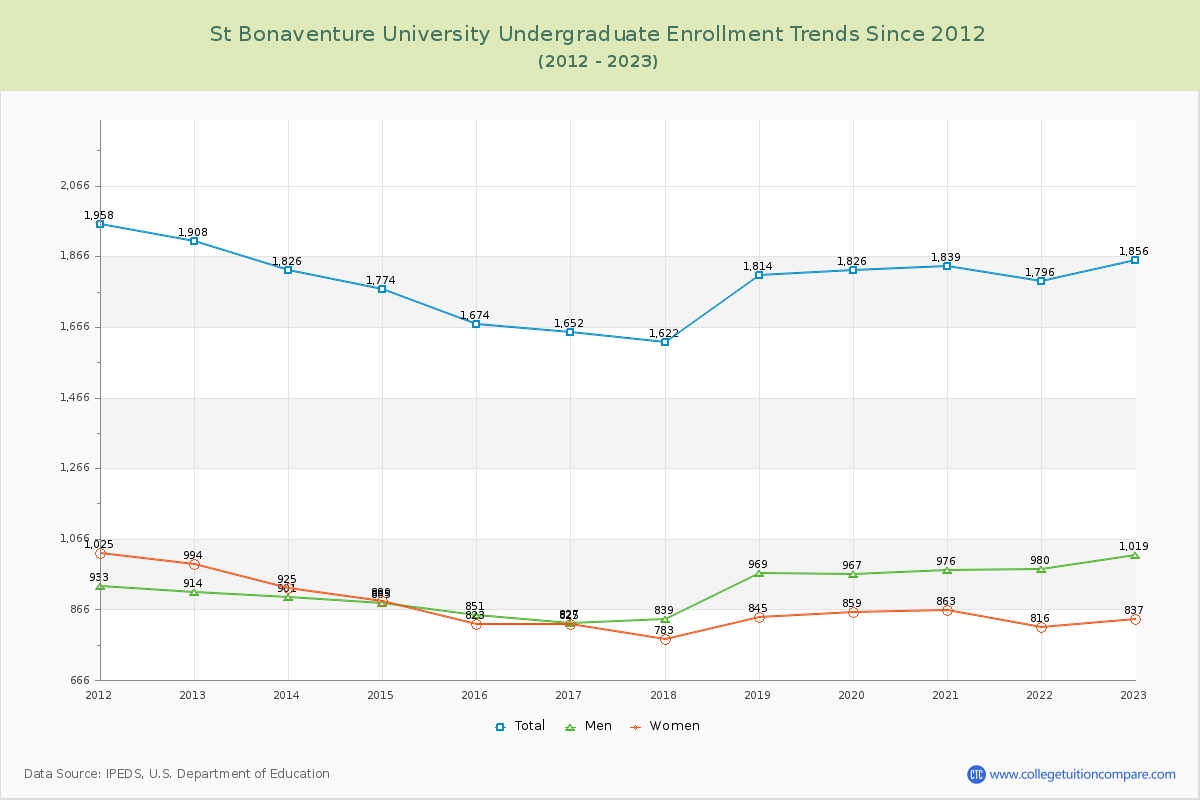
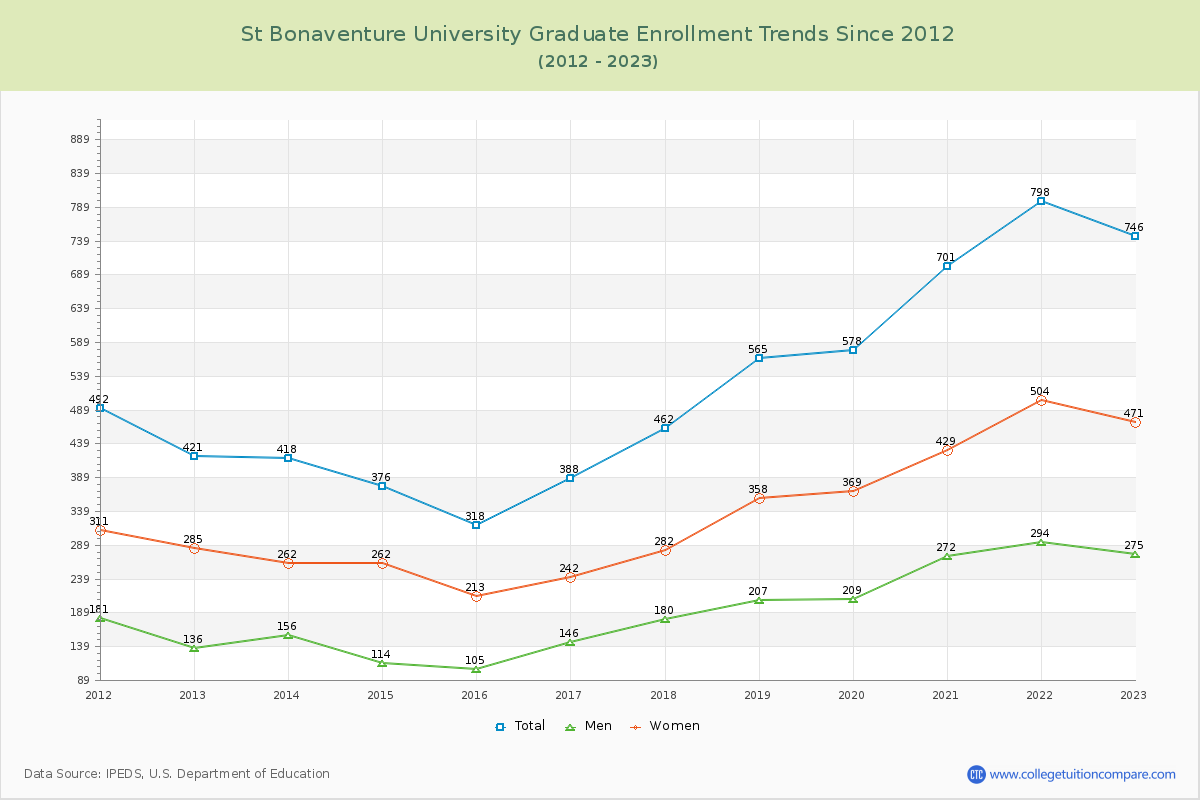
71.33% of total students is undergraduate students and 28.67% students is graduate students. The number of undergraduate students has decreased by 52 and the graduate enrollment has increased by 325 over past 10 years.
The female to male ratio is 1.01 to 1 and it means that there are similar numbers of female and male students enrolled in St. Bona.
The following table and chart illustrate the changes in student population by gender at St Bonaventure University since 2012.
| Year | Total | Undergraduate | Graduate | ||||
|---|---|---|---|---|---|---|---|
| Total | Men | Women | Total | Men | Women | ||
| 2012-13 | 2,329 | 1,908 | 914 | 994 | 421 | 136 | 285 |
| 2013-14 | 2,244 -85 | 1,826 -82 | 901 -13 | 925 -69 | 418 -3 | 156 20 | 262 -23 |
| 2014-15 | 2,150 -94 | 1,774 -52 | 885 -16 | 889 -36 | 376 -42 | 114 -42 | 262 0 |
| 2015-16 | 1,992 -158 | 1,674 -100 | 851 -34 | 823 -66 | 318 -58 | 105 -9 | 213 -49 |
| 2016-17 | 2,040 48 | 1,652 -22 | 827 -24 | 825 2 | 388 70 | 146 41 | 242 29 |
| 2017-18 | 2,084 44 | 1,622 -30 | 839 12 | 783 -42 | 462 74 | 180 34 | 282 40 |
| 2018-19 | 2,379 295 | 1,814 192 | 969 130 | 845 62 | 565 103 | 207 27 | 358 76 |
| 2019-20 | 2,404 25 | 1,826 12 | 967 -2 | 859 14 | 578 13 | 209 2 | 369 11 |
| 2020-21 | 2,540 136 | 1,839 13 | 976 9 | 863 4 | 701 123 | 272 63 | 429 60 |
| 2021-22 | 2,594 54 | 1,796 -43 | 980 4 | 816 -47 | 798 97 | 294 22 | 504 75 |
| 2022-23 | 2,602 8 | 1,856 60 | 1,019 39 | 837 21 | 746 -52 | 275 -19 | 471 -33 |
| Average | 2,305 | 1,781 | 921 | 860 | 525 | 190 | 334 |