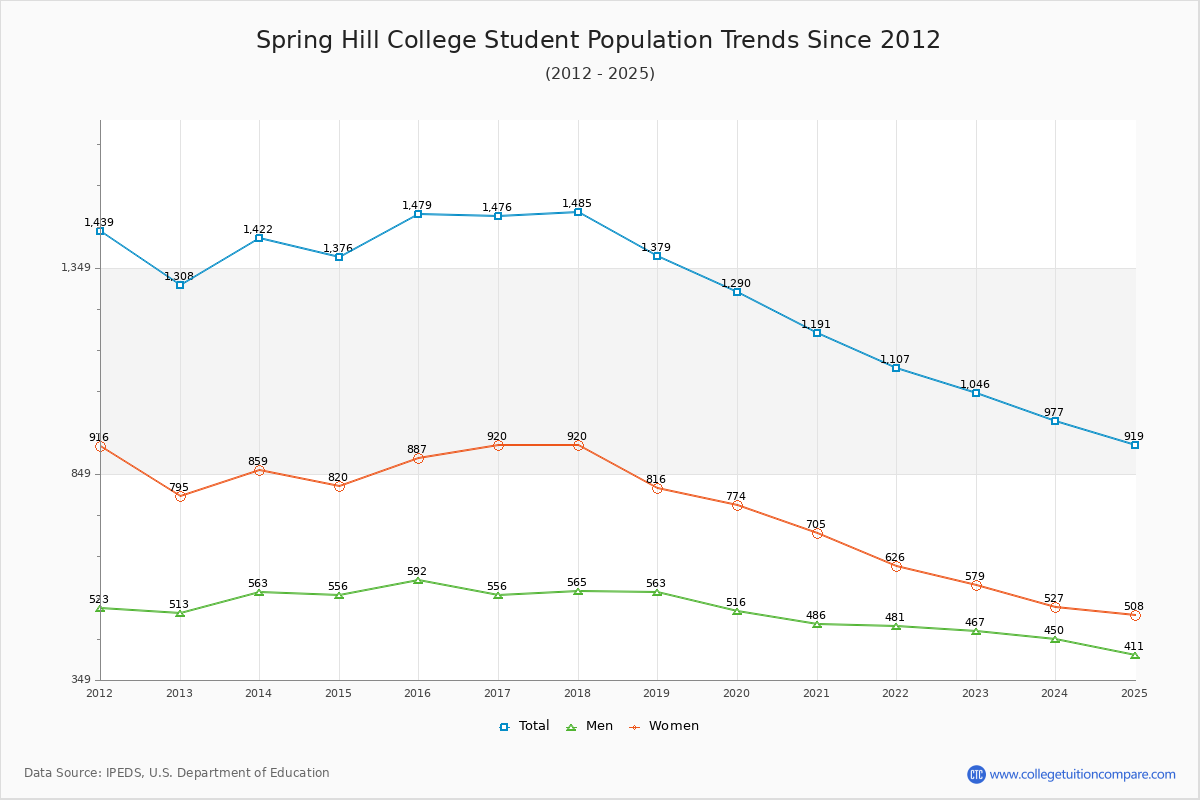
Student Population Changes
The average student population over the last 12 years is 1,324 where 1,046 students are attending the school for the academic year 2022-2023.
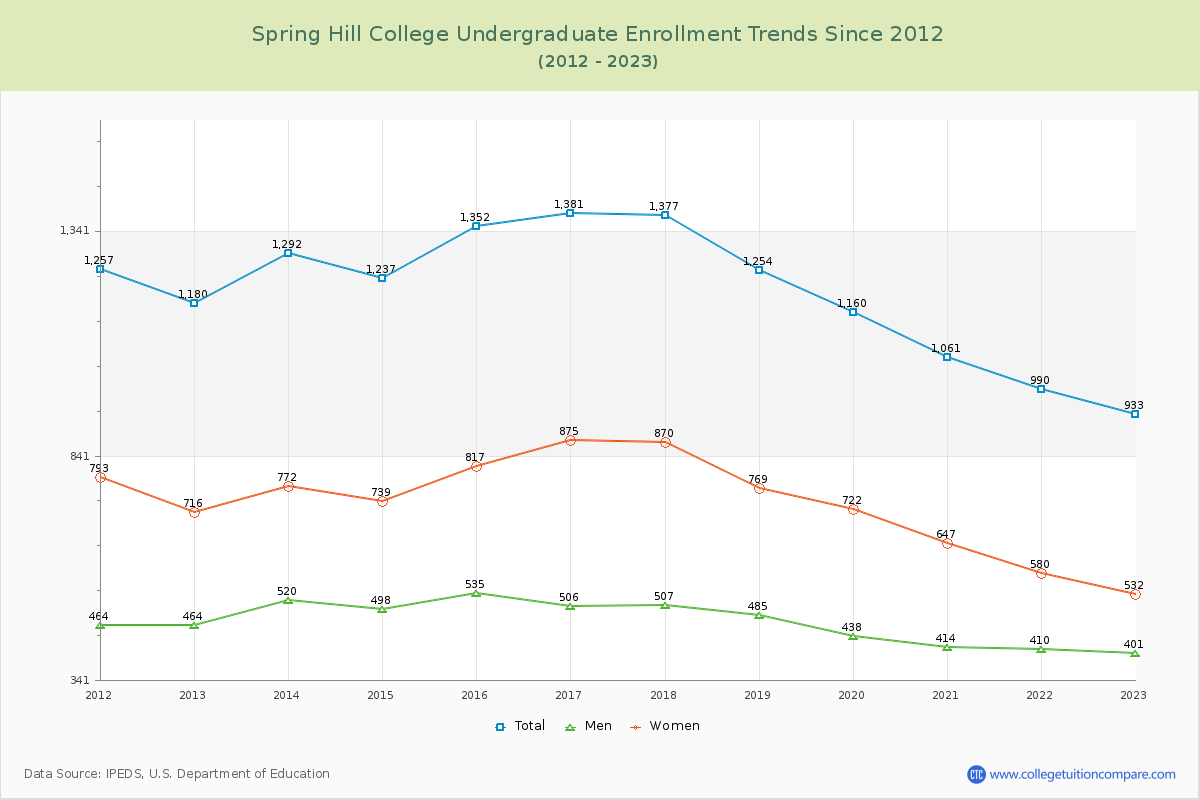
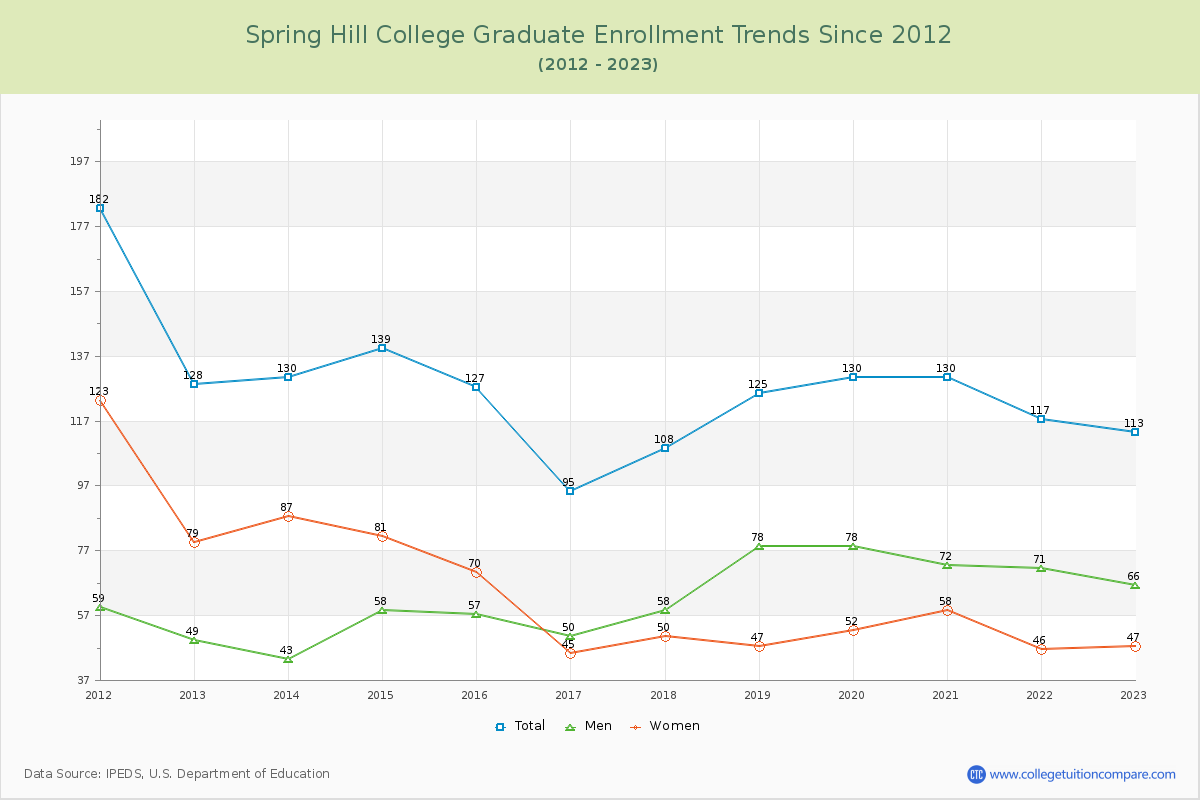
89.20% of total students is undergraduate students and 10.80% students is graduate students. The number of undergraduate students has decreased by 247 and the graduate enrollment has decreased by 15 over past 10 years.
The female to male ratio is 1.24 to 1 and it means that there are slightly more female students enrolled in SHC than male students.
The following table and chart illustrate the changes in student population by gender at Spring Hill College since 2012.
| Year | Total | Undergraduate | Graduate | ||||
|---|---|---|---|---|---|---|---|
| Total | Men | Women | Total | Men | Women | ||
| 2012-13 | 1,308 | 1,180 | 464 | 716 | 128 | 49 | 79 |
| 2013-14 | 1,422 114 | 1,292 112 | 520 56 | 772 56 | 130 2 | 43 -6 | 87 8 |
| 2014-15 | 1,376 -46 | 1,237 -55 | 498 -22 | 739 -33 | 139 9 | 58 15 | 81 -6 |
| 2015-16 | 1,479 103 | 1,352 115 | 535 37 | 817 78 | 127 -12 | 57 -1 | 70 -11 |
| 2016-17 | 1,476 -3 | 1,381 29 | 506 -29 | 875 58 | 95 -32 | 50 -7 | 45 -25 |
| 2017-18 | 1,485 9 | 1,377 -4 | 507 1 | 870 -5 | 108 13 | 58 8 | 50 5 |
| 2018-19 | 1,379 -106 | 1,254 -123 | 485 -22 | 769 -101 | 125 17 | 78 20 | 47 -3 |
| 2019-20 | 1,290 -89 | 1,160 -94 | 438 -47 | 722 -47 | 130 5 | 78 0 | 52 5 |
| 2020-21 | 1,191 -99 | 1,061 -99 | 414 -24 | 647 -75 | 130 0 | 72 -6 | 58 6 |
| 2021-22 | 1,107 -84 | 990 -71 | 410 -4 | 580 -67 | 117 -13 | 71 -1 | 46 -12 |
| 2022-23 | 1,046 -61 | 933 -57 | 401 -9 | 532 -48 | 113 -4 | 66 -5 | 47 1 |
| Average | 1,324 | 1,202 | 471 | 731 | 122 | 62 | 60 |