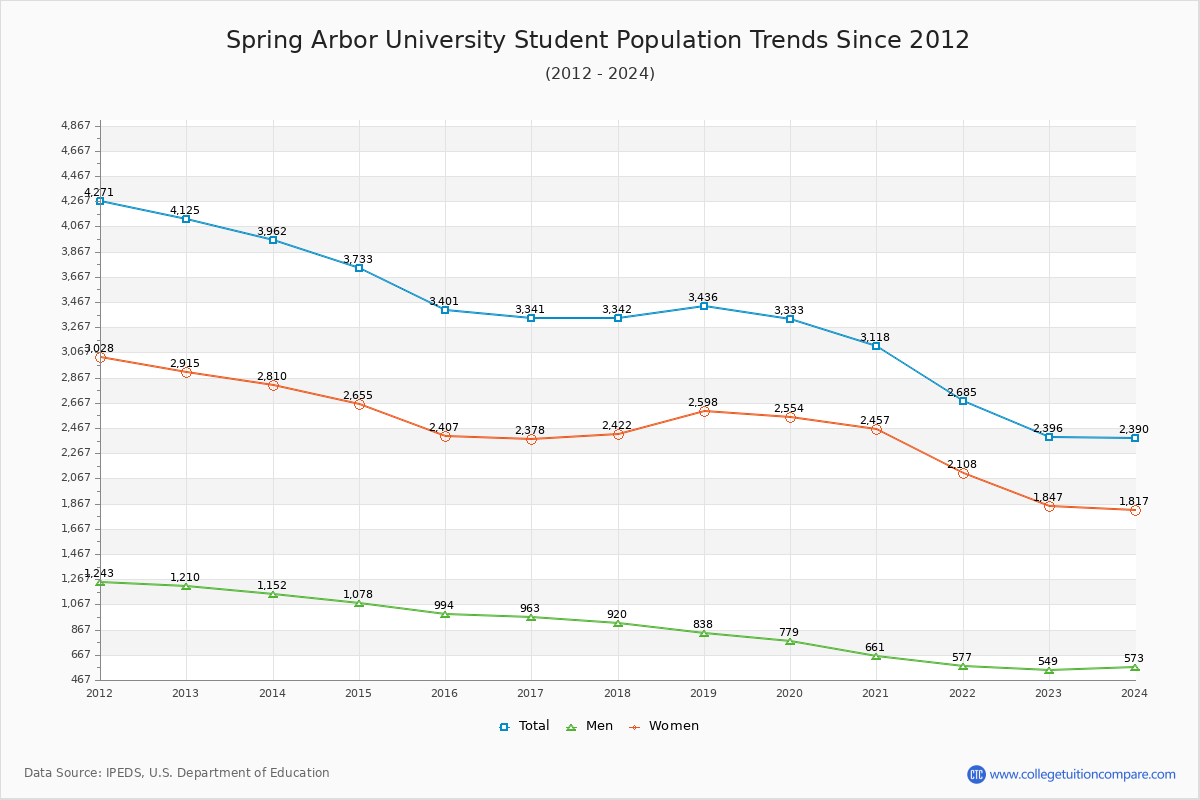
Student Population Changes
The average student population over the last 12 years is 3,352 where 2,396 students are attending the school for the academic year 2022-2023.
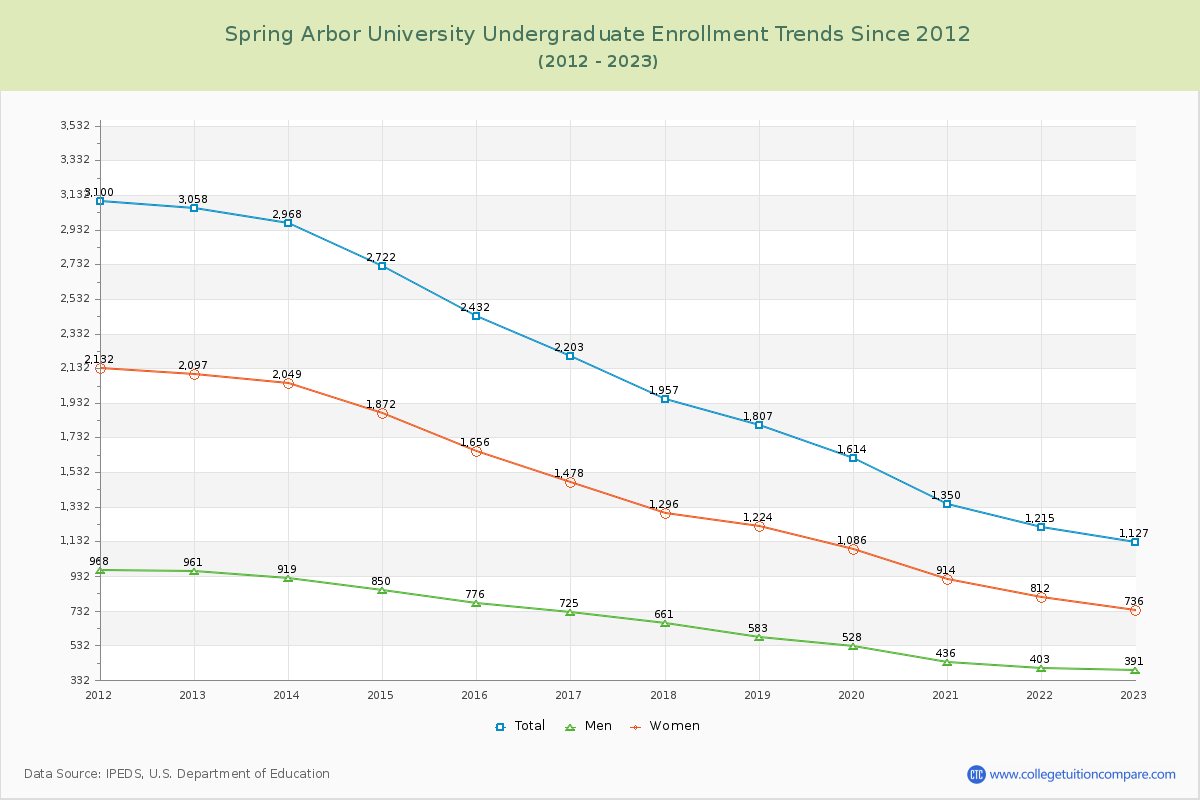
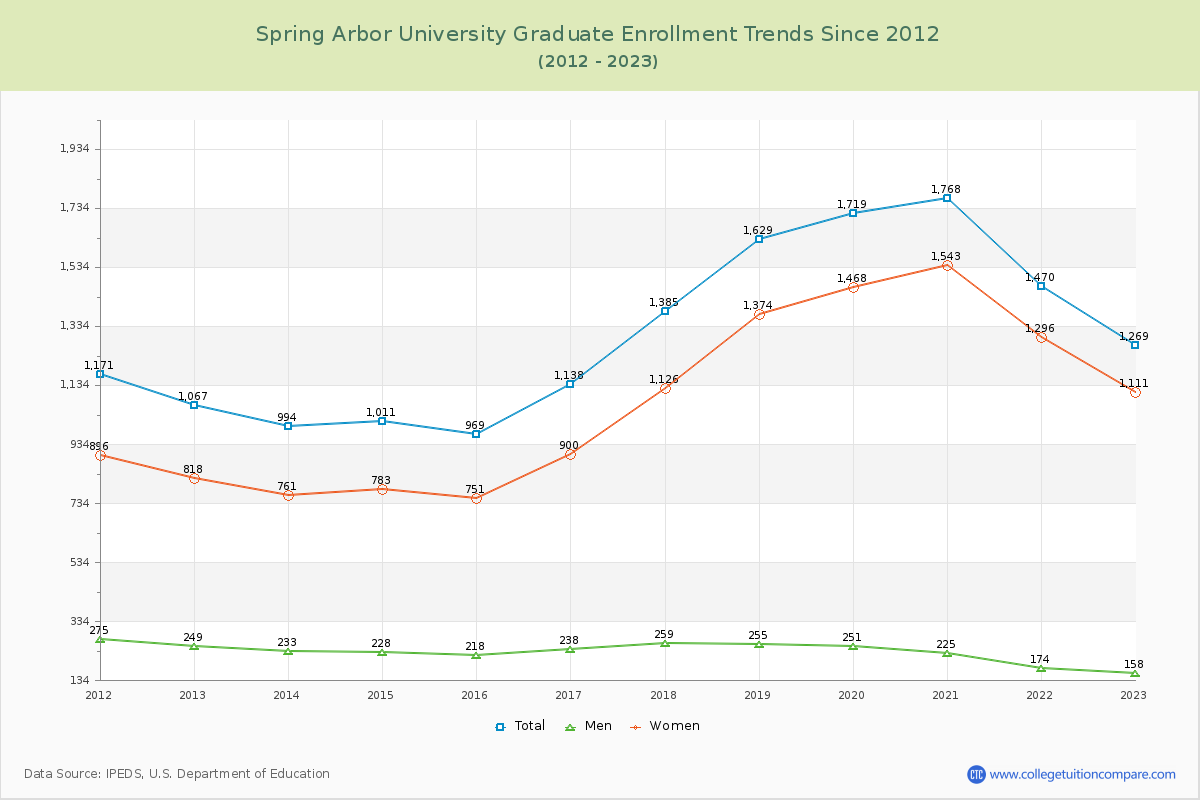
47.04% of total students is undergraduate students and 52.96% students is graduate students. The number of undergraduate students has decreased by 1,931 and the graduate enrollment has increased by 202 over past 10 years.
The female to male ratio is 3.36 to 1 and it means that there are far more female students enrolled in SAU than male students.
The following table and chart illustrate the changes in student population by gender at Spring Arbor University since 2012.
| Year | Total | Undergraduate | Graduate | ||||
|---|---|---|---|---|---|---|---|
| Total | Men | Women | Total | Men | Women | ||
| 2012-13 | 4,125 | 3,058 | 961 | 2,097 | 1,067 | 249 | 818 |
| 2013-14 | 3,962 -163 | 2,968 -90 | 919 -42 | 2,049 -48 | 994 -73 | 233 -16 | 761 -57 |
| 2014-15 | 3,733 -229 | 2,722 -246 | 850 -69 | 1,872 -177 | 1,011 17 | 228 -5 | 783 22 |
| 2015-16 | 3,401 -332 | 2,432 -290 | 776 -74 | 1,656 -216 | 969 -42 | 218 -10 | 751 -32 |
| 2016-17 | 3,341 -60 | 2,203 -229 | 725 -51 | 1,478 -178 | 1,138 169 | 238 20 | 900 149 |
| 2017-18 | 3,342 1 | 1,957 -246 | 661 -64 | 1,296 -182 | 1,385 247 | 259 21 | 1,126 226 |
| 2018-19 | 3,436 94 | 1,807 -150 | 583 -78 | 1,224 -72 | 1,629 244 | 255 -4 | 1,374 248 |
| 2019-20 | 3,333 -103 | 1,614 -193 | 528 -55 | 1,086 -138 | 1,719 90 | 251 -4 | 1,468 94 |
| 2020-21 | 3,118 -215 | 1,350 -264 | 436 -92 | 914 -172 | 1,768 49 | 225 -26 | 1,543 75 |
| 2021-22 | 2,685 -433 | 1,215 -135 | 403 -33 | 812 -102 | 1,470 -298 | 174 -51 | 1,296 -247 |
| 2022-23 | 2,396 -289 | 1,127 -88 | 391 -12 | 736 -76 | 1,269 -201 | 158 -16 | 1,111 -185 |
| Average | 3,352 | 2,041 | 658 | 1,384 | 1,311 | 226 | 1,085 |