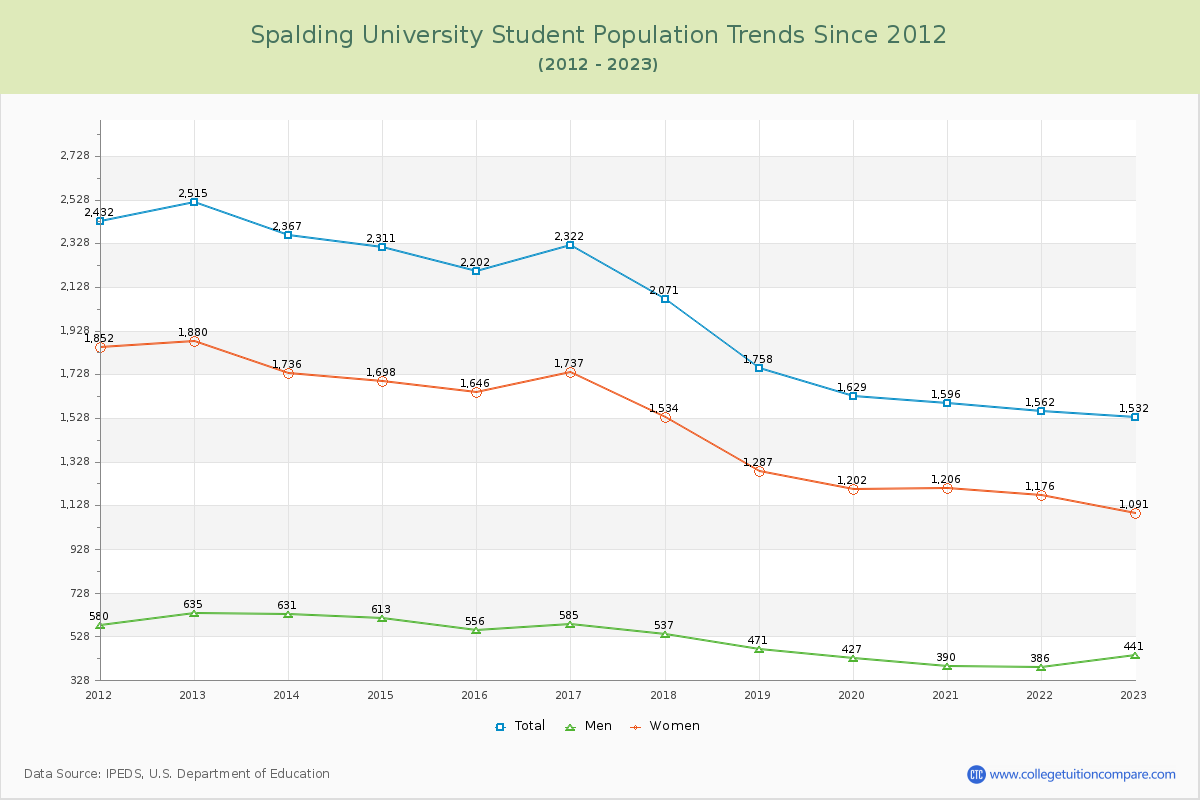
Student Population Changes
The average student population over the last 12 years is 1,988 where 1,532 students are attending the school for the academic year 2022-2023.
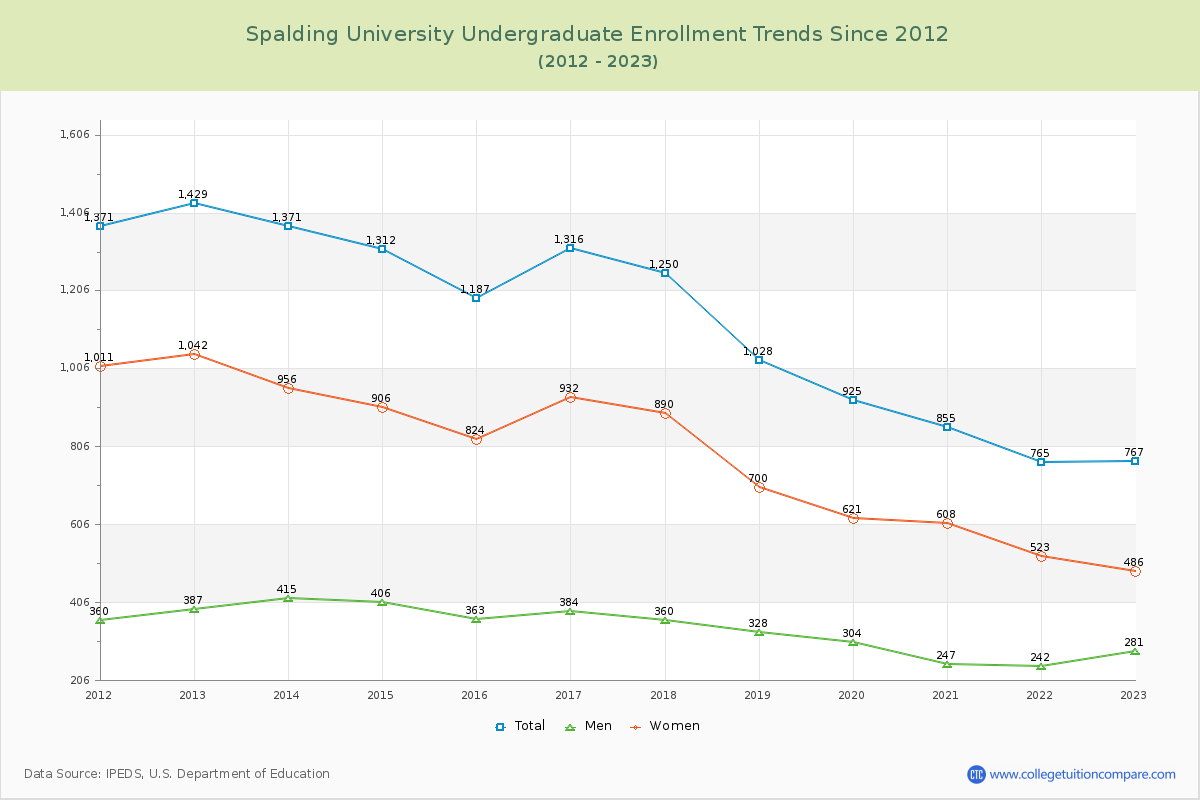
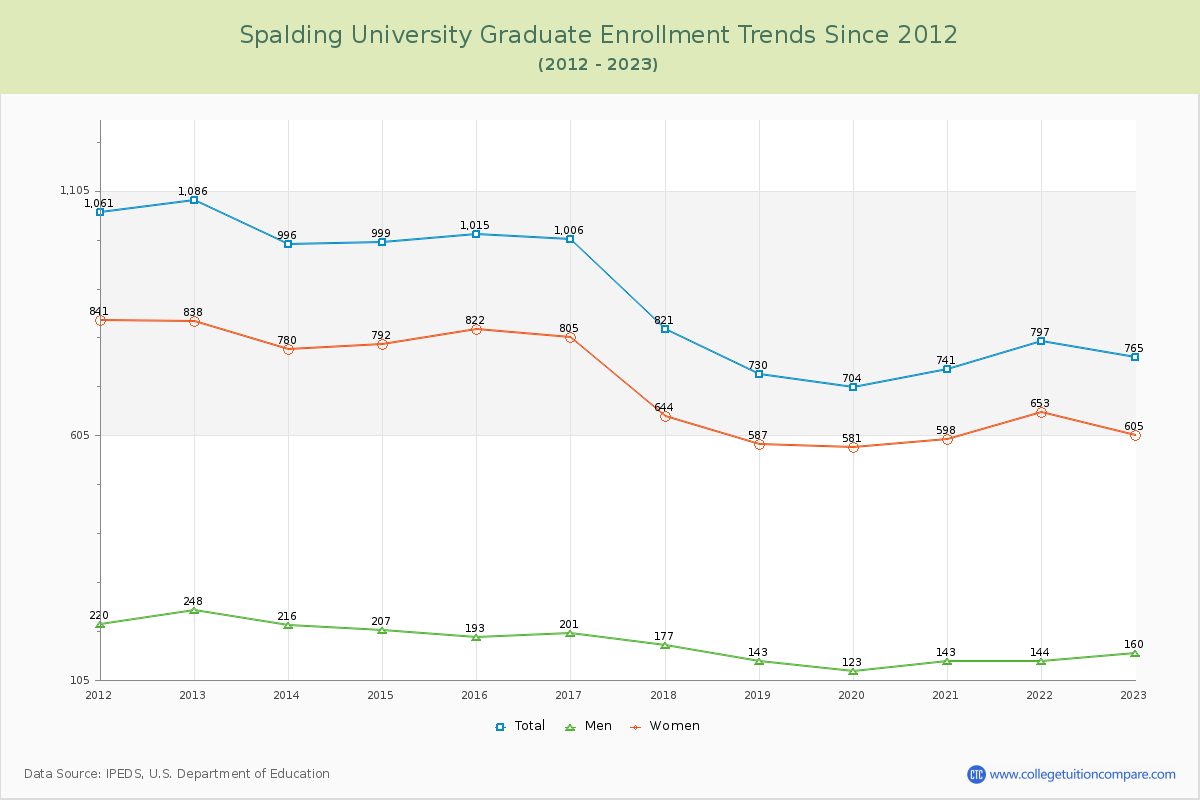
50.07% of total students is undergraduate students and 49.93% students is graduate students. The number of undergraduate students has decreased by 662 and the graduate enrollment has decreased by 321 over past 10 years.
The female to male ratio is 2.47 to 1 and it means that there are far more female students enrolled in Spalding than male students.
The following table and chart illustrate the changes in student population by gender at Spalding University since 2012.
| Year | Total | Undergraduate | Graduate | ||||
|---|---|---|---|---|---|---|---|
| Total | Men | Women | Total | Men | Women | ||
| 2012-13 | 2,515 | 1,429 | 387 | 1,042 | 1,086 | 248 | 838 |
| 2013-14 | 2,367 -148 | 1,371 -58 | 415 28 | 956 -86 | 996 -90 | 216 -32 | 780 -58 |
| 2014-15 | 2,311 -56 | 1,312 -59 | 406 -9 | 906 -50 | 999 3 | 207 -9 | 792 12 |
| 2015-16 | 2,202 -109 | 1,187 -125 | 363 -43 | 824 -82 | 1,015 16 | 193 -14 | 822 30 |
| 2016-17 | 2,322 120 | 1,316 129 | 384 21 | 932 108 | 1,006 -9 | 201 8 | 805 -17 |
| 2017-18 | 2,071 -251 | 1,250 -66 | 360 -24 | 890 -42 | 821 -185 | 177 -24 | 644 -161 |
| 2018-19 | 1,758 -313 | 1,028 -222 | 328 -32 | 700 -190 | 730 -91 | 143 -34 | 587 -57 |
| 2019-20 | 1,629 -129 | 925 -103 | 304 -24 | 621 -79 | 704 -26 | 123 -20 | 581 -6 |
| 2020-21 | 1,596 -33 | 855 -70 | 247 -57 | 608 -13 | 741 37 | 143 20 | 598 17 |
| 2021-22 | 1,562 -34 | 765 -90 | 242 -5 | 523 -85 | 797 56 | 144 1 | 653 55 |
| 2022-23 | 1,532 -30 | 767 2 | 281 39 | 486 -37 | 765 -32 | 160 16 | 605 -48 |
| Average | 1,988 | 1,110 | 338 | 772 | 878 | 178 | 700 |