Enrollment Trends at Southwest University at El Paso

661

Total Enrollment

165

Men

496

Women

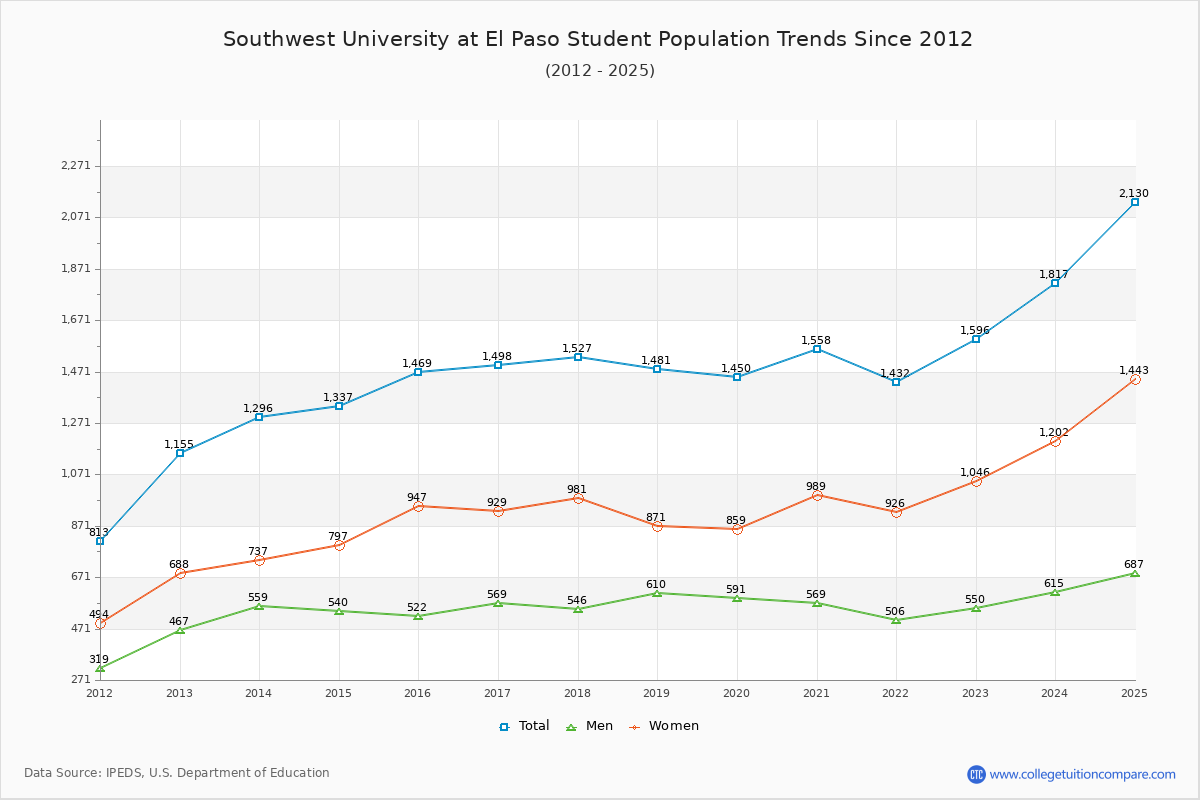
The student population at Southwest University at El Paso is 2,130 (2,073 undergraduate and 57 graduate students) . The number of students has increased by 661 over the past decade.

The percentage of undergraduate students at Southwest University at El Paso is 97.32% which is increased by 604 over last 10 years. The graduate student population increased by 57 and it has been increasing.

The female to male ratio is 2.10 to 1 which means that majority of population is on female students.

144 students enrolled in online degree program exclusively and the number of online students has decreased by % since 2015.

Student Population Changes

The average student population over the last 11 years is 1,596 where 2,130 students are attending the school for the academic year 2024-2025.

97.32% of total students is undergraduate students and 2.68% students is graduate students. The number of undergraduate students has increased by 604 and the graduate enrollment has increased by 57 over past 10 years.

The female to male ratio is 2.10 to 1 and it means that there are far more female students enrolled in Southwest University at El Paso than male students.

The following table and chart illustrate the changes in student population by gender at Southwest University at El Paso since 2015.

YearTotalUndergraduateGraduate
TotalMenWomenTotalMenWomen
2015-161,4691,469522947000
2016-171,498
29
1,498
29
569
47
929
-18
000
2017-181,527
29
1,527
29
546
-23
981
52
000
2018-191,481
-46
1,481
-46
610
64
871
-110
000
2019-201,450
-31
1,450
-31
591
-19
859
-12
000
2020-211,558
108
1,558
108
569
-22
989
130
000
2021-221,432
-126
1,432
-126
506
-63
926
-63
000
2022-231,596
164
1,596
164
550
44
1,046
120
000
2023-241,817
221
1,817
221
615
65
1,202
156
000
2024-252,130
313
2,073
256
668
53
1,405
203
57
57
19
19
38
38
Average1,5961,5905751,016624
Southwest University at El Paso Enrollment Trends Chart

Undergraduate Enrollment Changes

The average number of Undergraduate students over the last 11 years is 1,590 where 2,073 students are attending the Undergraduate school for the academic year 2024-2025. The following table and chart illustrate the changes in Undergraduate enrollment by attending status and gender at Southwest University at El Paso since 2015.

YearTotalMenWomen
2015-161,4691,469522947000
2016-171,4981,498569929000
2017-181,5271,527546981000
2018-191,4811,481610871000
2019-201,4501,450591859000
2020-211,5581,558569989000
2021-221,4321,432506926000
2022-231,5961,5965501,046000
2023-241,8171,8176151,202000
2024-252,0732,0736681,405000
Average1,5901,5905751,0161,59000
Southwest University at El Paso Undergraduate Enrollment Trends Chart

Graduate Enrollment Changes

The average number of Graduate students over the last 11 years is 6 where 57 students are attending the Graduate school for the academic year 2024-2025. The following table and chart illustrate the changes in Graduate enrollment by attending status and gender at Southwest University at El Paso since 2015.

YearTotalMenWomen
2015-160000000
2016-170000000
2017-180000000
2018-190000000
2019-200000000
2020-210000000
2021-220000000
2022-230000000
2023-240000000
2024-2557571938000
Average6624600
Southwest University at El Paso Graduate Enrollment Trends Chart

Enrollment by Race/Ethnicity Changes

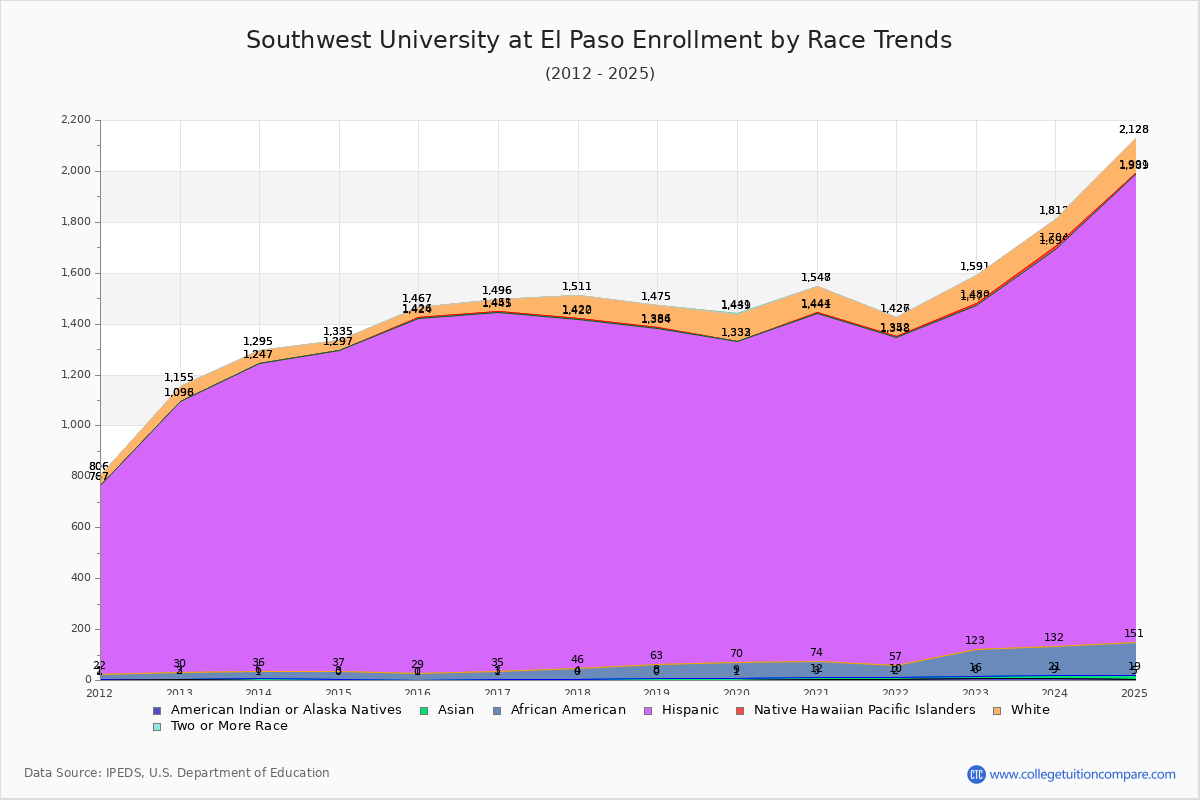
The percentage of white students is 6.43% and the percentage of black students is 6.20% at Southwest University at El Paso. 0.66% of enrolled students is Asian. Hispanic students comprise 86.29% of the student body.

Over the past 10 years, the racial composition has shifted. The percentage of white students increased from 2.79% to 6.43%. Asian enrollment grew from 0.07% to 0.66%. Black student enrollment increased from 1.91% to 6.20%. Hispanic student representation contracted from 94.96% to 86.29%.

The overall racial diversity, measured by the Census Bureau Diversity Index, is 0.2474 which indicates that not very diverse. This increased from 0.0971 a decade ago, suggesting that racial diversity has improved.

The following table and chart illustrate the student population trends by race/ethnicity at Southwest University at El Paso over the past 11 years (2015-2025).

YearAmerican Indian or Native AmericanAsianBlackHispanicNative Hawaiian or Other Pacific IslanderWhiteTwo or More Races
2015-1601281,3952410
2016-1712321,4106450
2017-1804421,3742890
2018-1908551,3212890
2019-2018611,26211062
2020-2139621,36731031
2021-2228471,2914741
2022-236101071,35071110
2023-249121111,56391080
2024-255141321,83821370
Average38681,4174900
Southwest University at El Paso Enrollment by Race Trends Chart

Distance Learning (Online Courses) Enrollment Changes

144 students are enrolled in online degree programs exclusively for the academic year 2024-2025, which is 7% of total students. The number of online students has decreased % since 2015. The following table and chart illustrate the changes in the online student population by enrolled type at Southwest University at El Paso from 2015 to 2025.

YearTotal EnrollmentOnline CompletelyEnrolled in Some Online CoursesNot Enrolled in Online Courses
2015-161,469001,469
2016-171,498301,495
2017-181,5272701,500
2018-191,4811801,463
2019-201,4501801,432
2020-211,5581701,541
2021-221,432281,4040
2022-231,596301,5660
2023-241,817951,7220
2024-252,1301441,9860
Average1,59638668890

Ratings & Review

Share your experiences and thoughts about Southwest University at El Paso. It will be a great help to applicants and prospective students!