Enrollment Trends at SWCID

-67

Total Enrollment

-37

Men

-30

Women

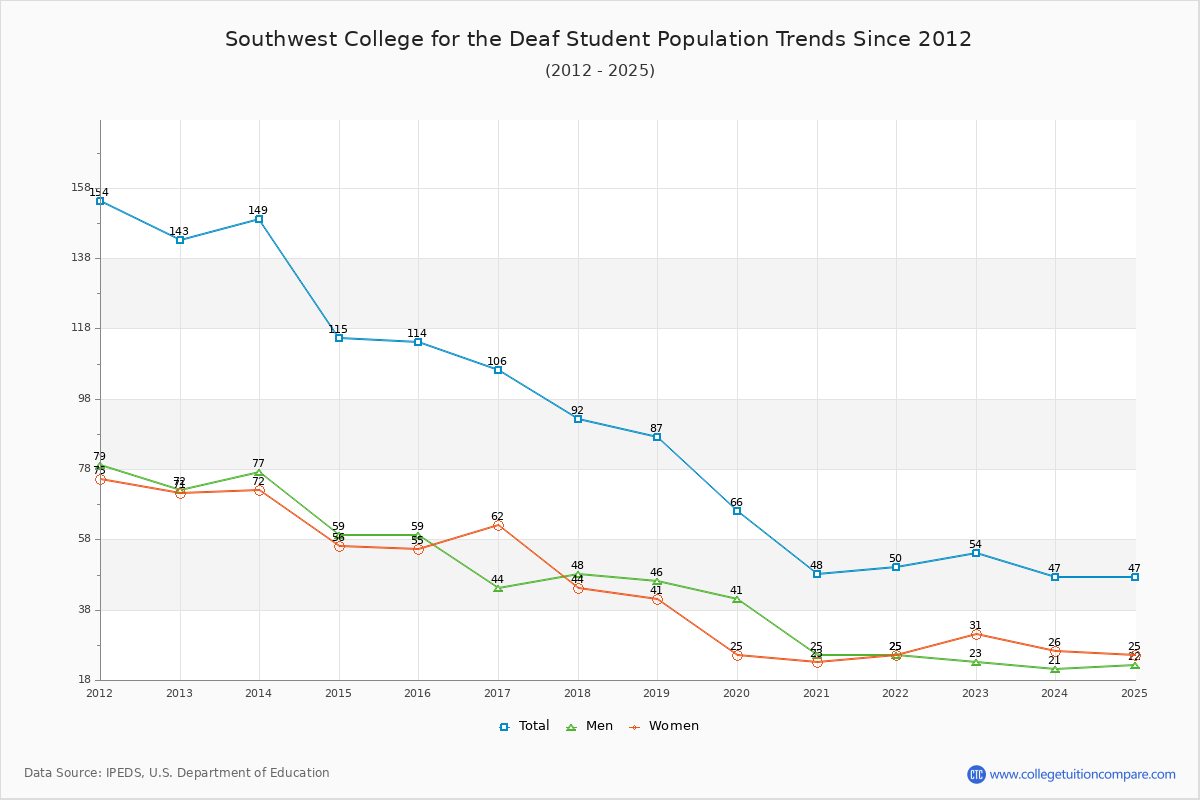
The student population at Southwest College for the Deaf is 47 (all undergraduate). The number of students has decreased by 67 over the past decade.

The female to male ratio is 1.14 to 1 which means that female students enrolled slightly more than male students.

1 students enrolled in online degree program exclusively and the number of online students has decreased by -50.00% since 2015.

Student Population Changes

The average student population over the last 11 years is 71 where 47 students are attending the school for the academic year 2024-2025.

The female to male ratio is 1.14 to 1 and it means that there are slightly more female students enrolled in SWCID than male students.

The following table and chart illustrate the changes in student population by gender at Southwest College for the Deaf since 2015.

YearTotalMenWomen
2015-161145955
2016-17106
-8
44
-15
62
7
2017-1892
-14
48
4
44
-18
2018-1987
-5
46
-2
41
-3
2019-2066
-21
41
-5
25
-16
2020-2148
-18
25
-16
23
-2
2021-2250
2
2525
2
2022-2354
4
23
-2
31
6
2023-2447
-7
21
-2
26
-5
2024-254722
1
25
-1
Average713536
Southwest College for the Deaf Enrollment Trends Chart

Enrollment by Race/Ethnicity Changes

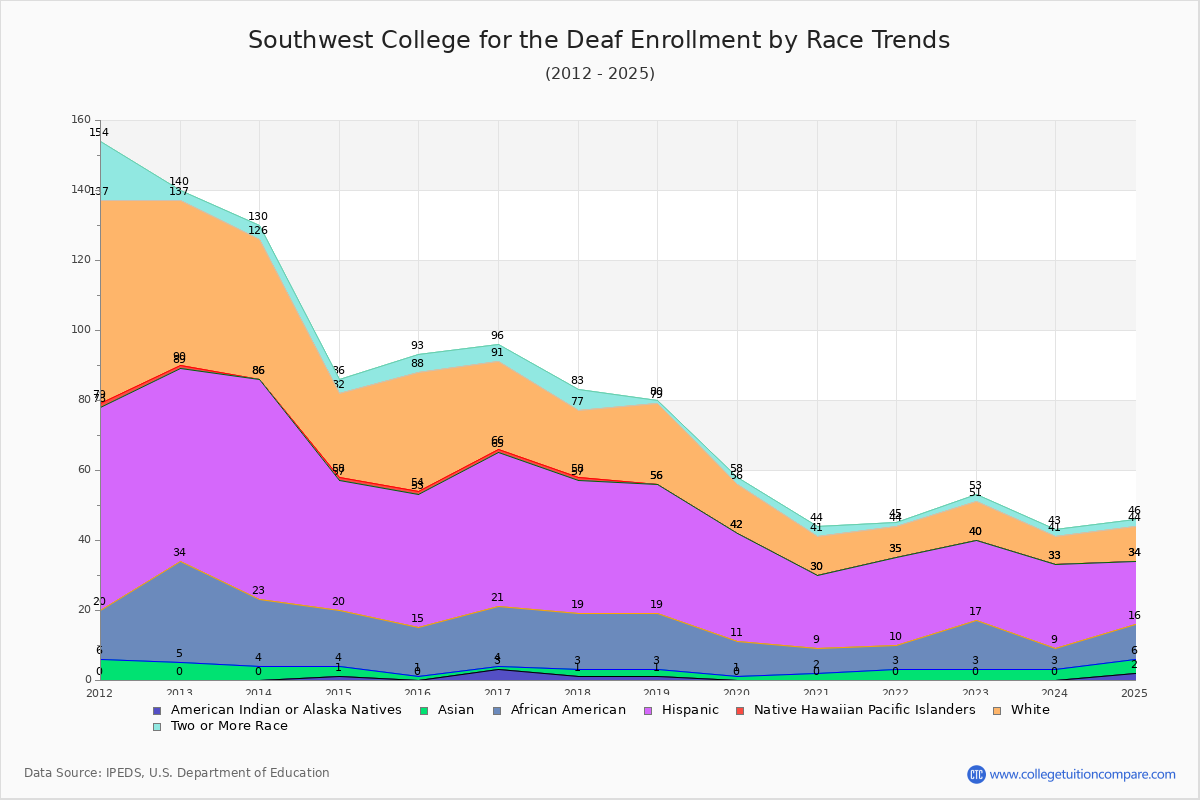
The percentage of white students is 21.28% and the percentage of black students is 21.28% at Southwest College for the Deaf. 8.51% of enrolled students is Asian. Hispanic students comprise 38.30% of the student body.

Over the past 10 years, the racial composition has shifted. The percentage of white students decreased from 29.82% to 21.28%. Asian enrollment grew from 0.88% to 8.51%. Black student enrollment increased from 12.28% to 21.28%. Hispanic student representation expanded from 33.33% to 38.30%.

The overall racial diversity, measured by the Census Bureau Diversity Index, is 0.7519 which indicates that quite diverse. This decreased from 0.7828 a decade ago, suggesting that racial diversity has declined.

The following table and chart illustrate the student population trends by race/ethnicity at Southwest College for the Deaf over the past 11 years (2015-2025).

YearAmerican Indian or Native AmericanAsianBlackHispanicNative Hawaiian or Other Pacific IslanderWhiteTwo or More Races
2015-160114381345
2016-173117441255
2017-181216381196
2018-191216370231
2019-200110310142
2020-21027210113
2021-2203725091
2022-230314230112
2023-2403624082
2024-252410180102
Average1212300163
Southwest College for the Deaf Enrollment by Race Trends Chart

Distance Learning (Online Courses) Enrollment Changes

1 students are enrolled in online degree programs exclusively for the academic year 2024-2025, which is 2% of total students. The number of online students has decreased -50.00% since 2015. The following table and chart illustrate the changes in the online student population by enrolled type at Southwest College for the Deaf from 2015 to 2025.

YearTotal EnrollmentOnline CompletelyEnrolled in Some Online CoursesNot Enrolled in Online Courses
2015-1611421894
2016-1710631984
2017-189231178
2018-198711373
2019-206611451
2020-21482460
2021-22503938
2022-235431536
2023-24470839
2024-254712323
Average7121852

Ratings & Review

Share your experiences and thoughts about Southwest College for the Deaf. It will be a great help to applicants and prospective students!