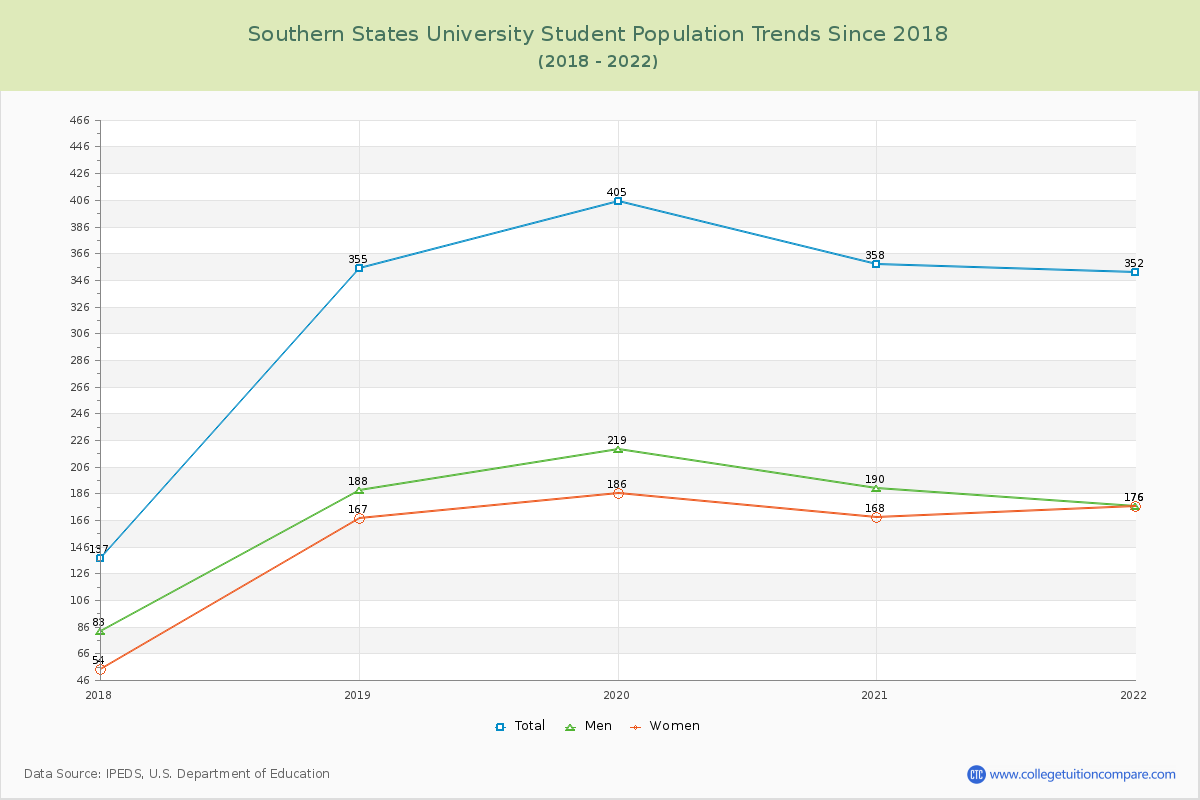
Student Population Changes
The average student population over the last 6 years is 321 where 352 students are attending the school for the academic year 2021-2022.
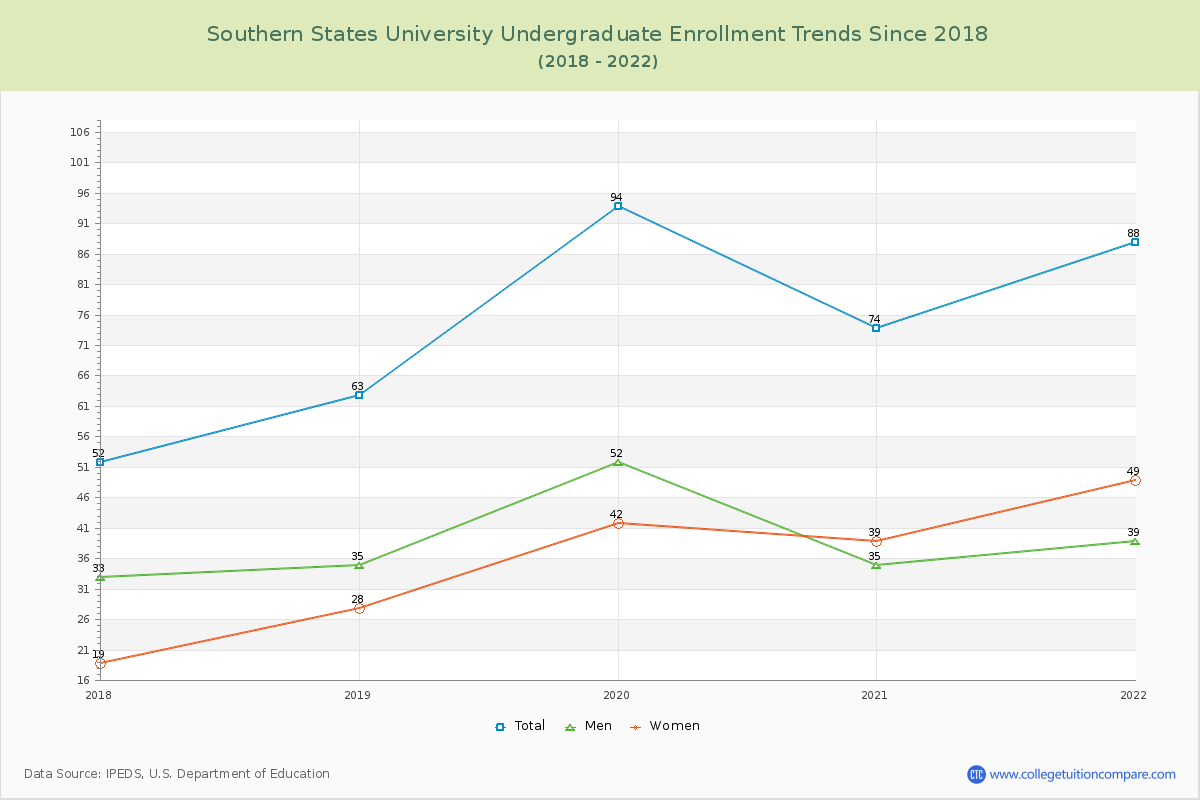
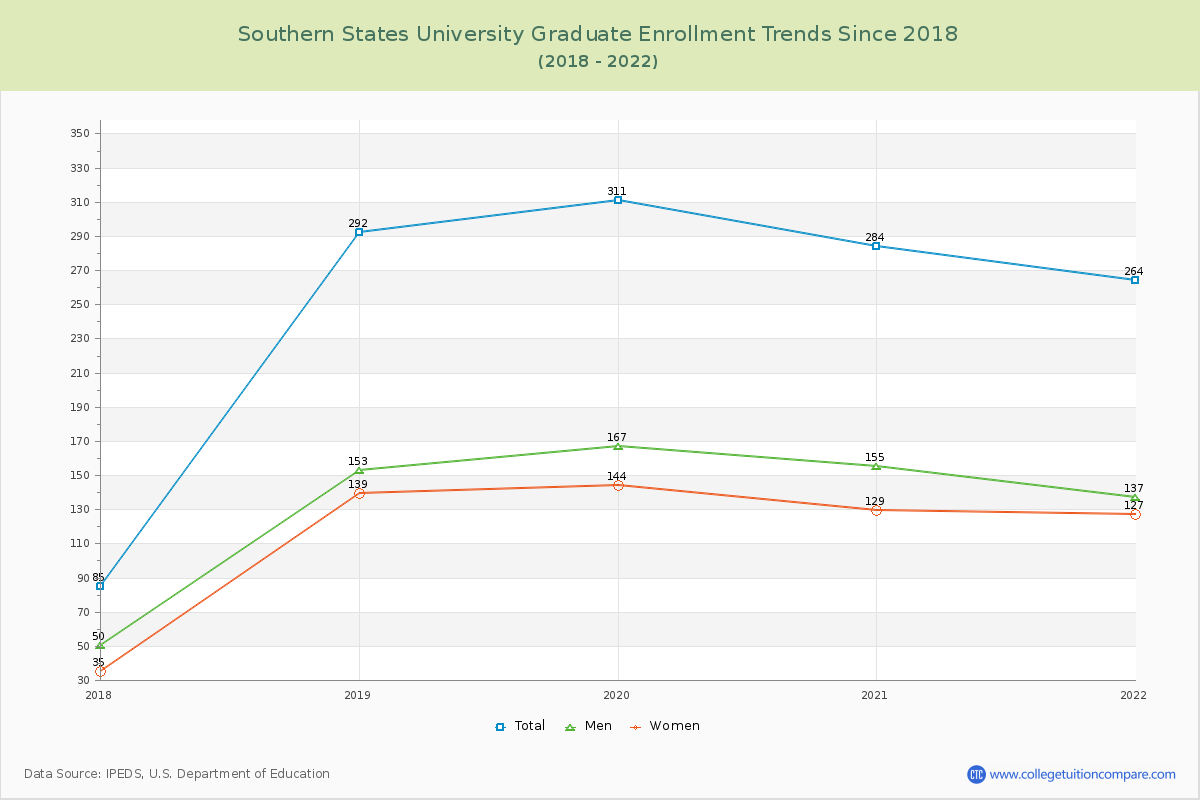
25.00% of total students is undergraduate students and 75.00% students is graduate students. The number of undergraduate students has increased by 36 and the graduate enrollment has increased by 179 over past 10 years.
The female to male ratio is 1.00 to 1 and it means that there are similar numbers of female and male students enrolled in Southern States.
The following table and chart illustrate the changes in student population by gender at Southern States University since 2017.
| Year | Total | Undergraduate | Graduate | ||||
|---|---|---|---|---|---|---|---|
| Total | Men | Women | Total | Men | Women | ||
| 2017-18 | 137 | 52 | 33 | 19 | 85 | 50 | 35 |
| 2018-19 | 355 218 | 63 11 | 35 2 | 28 9 | 292 207 | 153 103 | 139 104 |
| 2019-20 | 405 50 | 94 31 | 52 17 | 42 14 | 311 19 | 167 14 | 144 5 |
| 2020-21 | 358 -47 | 74 -20 | 35 -17 | 39 -3 | 284 -27 | 155 -12 | 129 -15 |
| 2021-22 | 352 -6 | 88 14 | 39 4 | 49 10 | 264 -20 | 137 -18 | 127 -2 |
| Average | 321 | 74 | 39 | 35 | 247 | 132 | 115 |