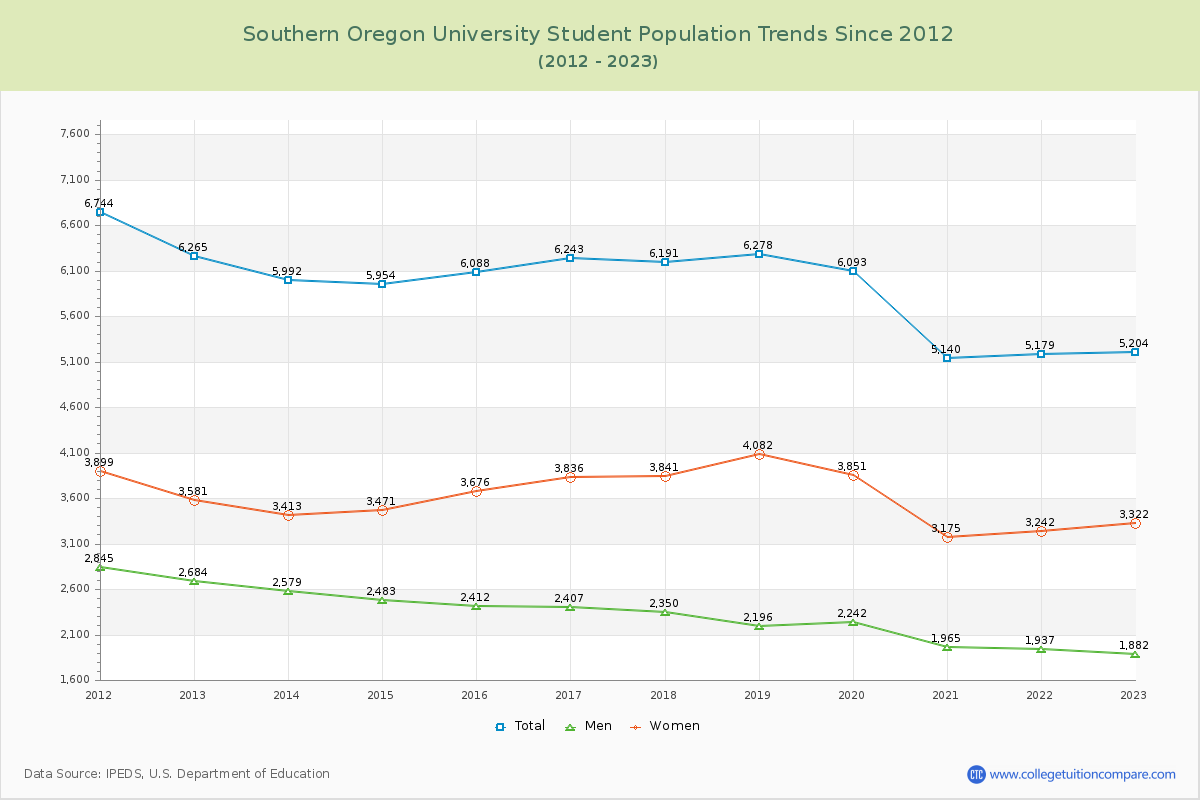
Student Population Changes
The average student population over the last 12 years is 5,875 where 5,204 students are attending the school for the academic year 2022-2023.
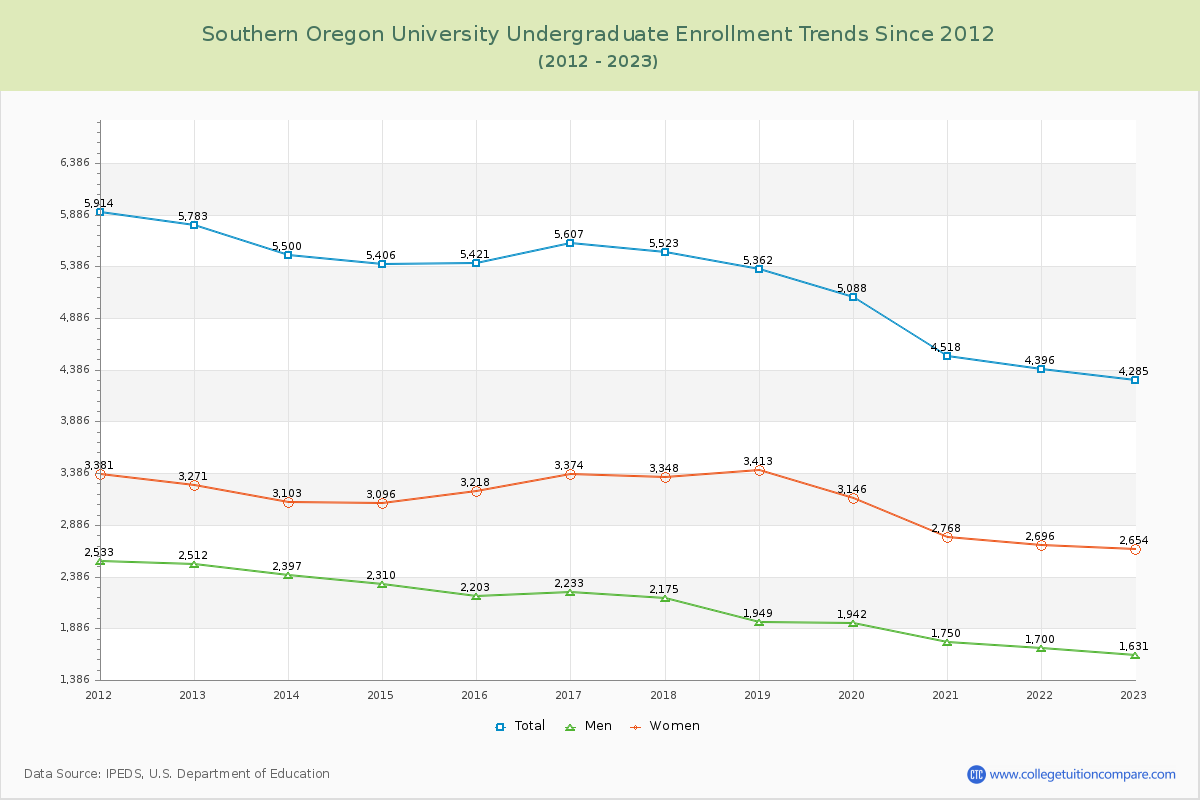
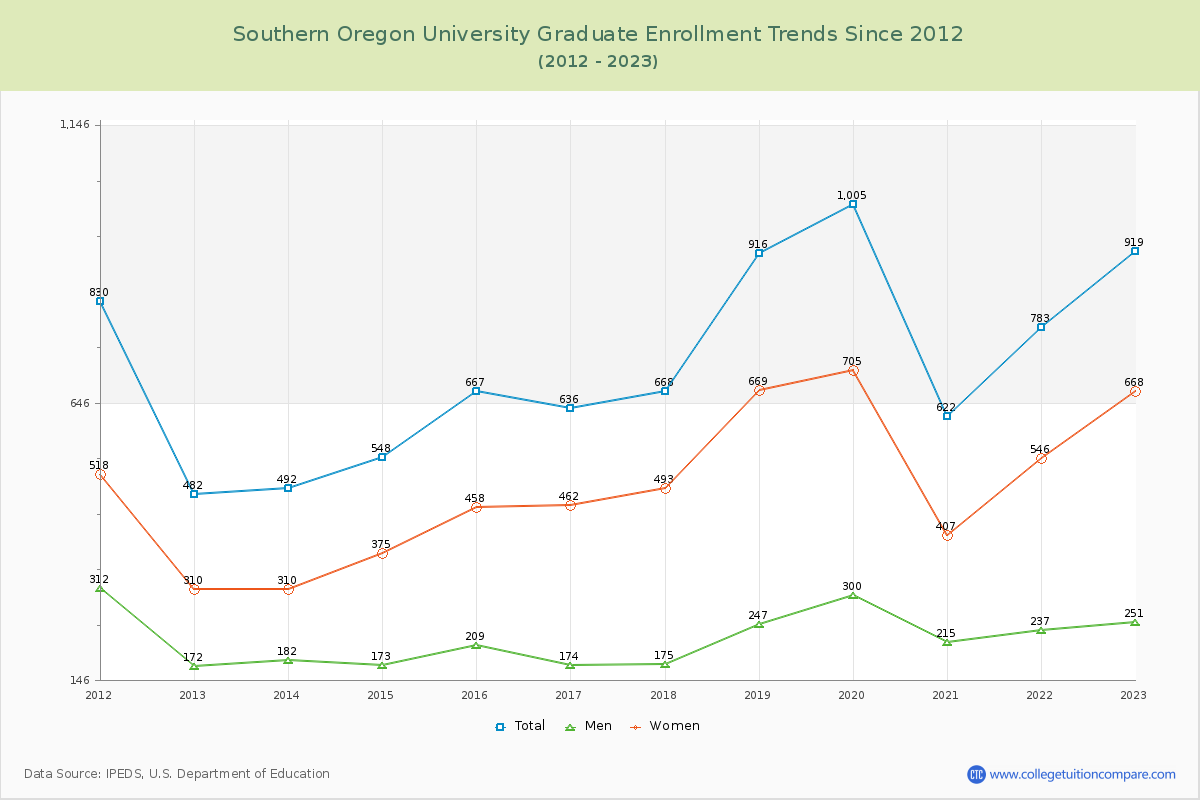
82.34% of total students is undergraduate students and 17.66% students is graduate students. The number of undergraduate students has decreased by 1,498 and the graduate enrollment has increased by 437 over past 10 years.
The female to male ratio is 1.77 to 1 and it means that there are more female students enrolled in Southern Oregon than male students.
The following table and chart illustrate the changes in student population by gender at Southern Oregon University since 2012.
| Year | Total | Undergraduate | Graduate | ||||
|---|---|---|---|---|---|---|---|
| Total | Men | Women | Total | Men | Women | ||
| 2012-13 | 6,265 | 5,783 | 2,512 | 3,271 | 482 | 172 | 310 |
| 2013-14 | 5,992 -273 | 5,500 -283 | 2,397 -115 | 3,103 -168 | 492 10 | 182 10 | 310 0 |
| 2014-15 | 5,954 -38 | 5,406 -94 | 2,310 -87 | 3,096 -7 | 548 56 | 173 -9 | 375 65 |
| 2015-16 | 6,088 134 | 5,421 15 | 2,203 -107 | 3,218 122 | 667 119 | 209 36 | 458 83 |
| 2016-17 | 6,243 155 | 5,607 186 | 2,233 30 | 3,374 156 | 636 -31 | 174 -35 | 462 4 |
| 2017-18 | 6,191 -52 | 5,523 -84 | 2,175 -58 | 3,348 -26 | 668 32 | 175 1 | 493 31 |
| 2018-19 | 6,278 87 | 5,362 -161 | 1,949 -226 | 3,413 65 | 916 248 | 247 72 | 669 176 |
| 2019-20 | 6,093 -185 | 5,088 -274 | 1,942 -7 | 3,146 -267 | 1,005 89 | 300 53 | 705 36 |
| 2020-21 | 5,140 -953 | 4,518 -570 | 1,750 -192 | 2,768 -378 | 622 -383 | 215 -85 | 407 -298 |
| 2021-22 | 5,179 39 | 4,396 -122 | 1,700 -50 | 2,696 -72 | 783 161 | 237 22 | 546 139 |
| 2022-23 | 5,204 25 | 4,285 -111 | 1,631 -69 | 2,654 -42 | 919 136 | 251 14 | 668 122 |
| Average | 5,875 | 5,172 | 2,073 | 3,099 | 703 | 212 | 491 |