Enrollment Trends at Southern Careers Institute-Harlingen

115

Total Enrollment

132

Men

-17

Women

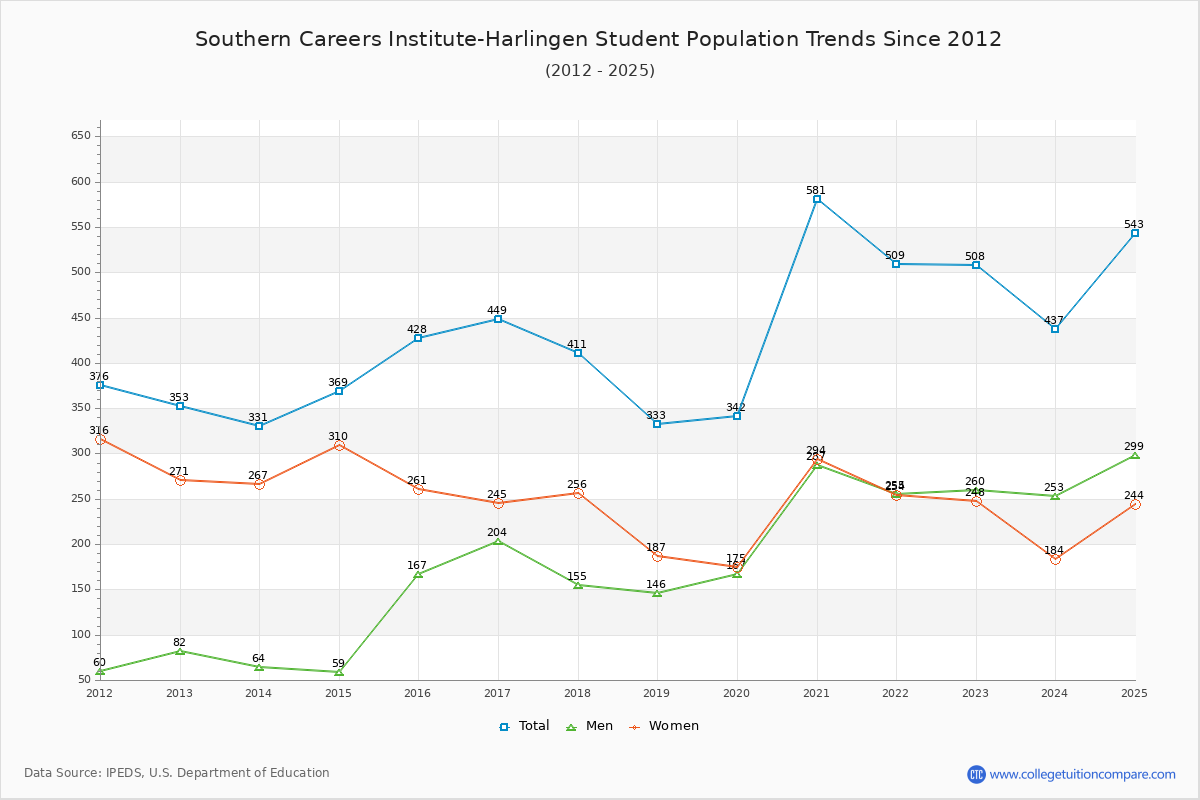
The student population at Southern Careers Institute-Harlingen is 543 (all undergraduate). The number of students has increased by 115 over the past decade.

The female to male ratio is 0.82 to 1 which means that male students enrolled slightly more than female students.

15 students enrolled in online degree program exclusively and the number of online students has increased by 468.89% since 2015.

Student Population Changes

The average student population over the last 11 years is 454 where 543 students are attending the school for the academic year 2024-2025.

The female to male ratio is 0.82 to 1 and it means that there are slightly more male students enrolled in Southern Careers Institute-Harlingen than female students.

The following table and chart illustrate the changes in student population by gender at Southern Careers Institute-Harlingen since 2015.

YearTotalMenWomen
2015-16428167261
2016-17449
21
204
37
245
-16
2017-18411
-38
155
-49
256
11
2018-19333
-78
146
-9
187
-69
2019-20342
9
167
21
175
-12
2020-21581
239
287
120
294
119
2021-22509
-72
255
-32
254
-40
2022-23508
-1
260
5
248
-6
2023-24437
-71
253
-7
184
-64
2024-25543
106
299
46
244
60
Average454219235
Southern Careers Institute-Harlingen Enrollment Trends Chart

Enrollment by Race/Ethnicity Changes

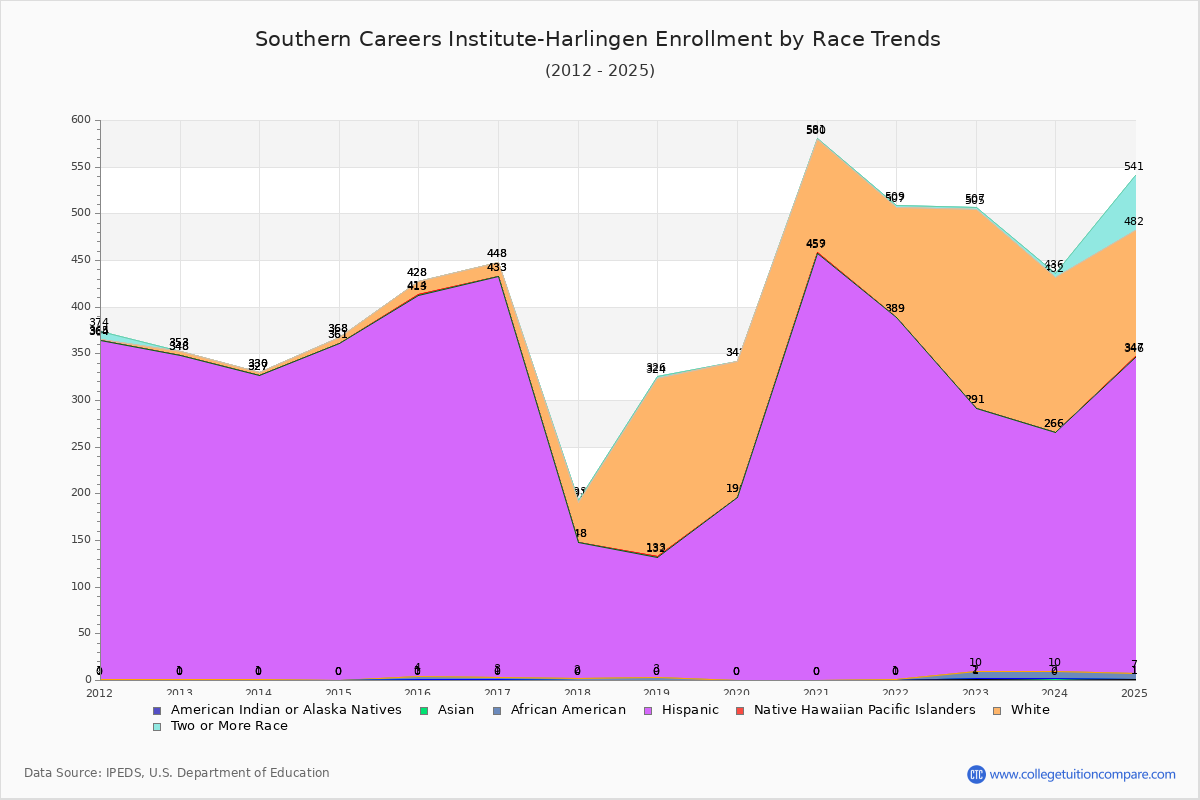
The percentage of white students is 24.86% and the percentage of black students is 1.10% at Southern Careers Institute-Harlingen. Hispanic students comprise 62.43% of the student body.

Over the past 10 years, the racial composition has shifted. The percentage of white students increased from 3.27% to 24.86%. Black student enrollment increased from 0.70% to 1.10%. Hispanic student representation contracted from 95.56% to 62.43%.

The overall racial diversity, measured by the Census Bureau Diversity Index, is 0.5365 which indicates that somewhat diverse. This increased from 0.0857 a decade ago, suggesting that racial diversity has improved.

The following table and chart illustrate the student population trends by race/ethnicity at Southern Careers Institute-Harlingen over the past 11 years (2015-2025).

YearAmerican Indian or Native AmericanAsianBlackHispanicNative Hawaiian or Other Pacific IslanderWhiteTwo or More Races
2015-160134091140
2016-170124300150
2017-180021460432
2018-1900312911912
2019-2000019601460
2020-2100045721211
2021-2200138801182
2022-2311828102142
2023-2402825601664
2024-25106339113559
Average01330311167
Southern Careers Institute-Harlingen Enrollment by Race Trends Chart

Distance Learning (Online Courses) Enrollment Changes

15 students are enrolled in online degree programs exclusively for the academic year 2024-2025, which is 3% of total students. The number of online students has increased 468.89% since 2015. The following table and chart illustrate the changes in the online student population by enrolled type at Southern Careers Institute-Harlingen from 2015 to 2025.

YearTotal EnrollmentOnline CompletelyEnrolled in Some Online CoursesNot Enrolled in Online Courses
2015-16428045383
2016-1744901448
2017-1841100411
2018-1933300333
2019-2034201341
2020-21581034547
2021-2250905090
2022-235080272236
2023-244370204233
2024-2554315256272
Average4542132320

Ratings & Review

Share your experiences and thoughts about Southern Careers Institute-Harlingen. It will be a great help to applicants and prospective students!