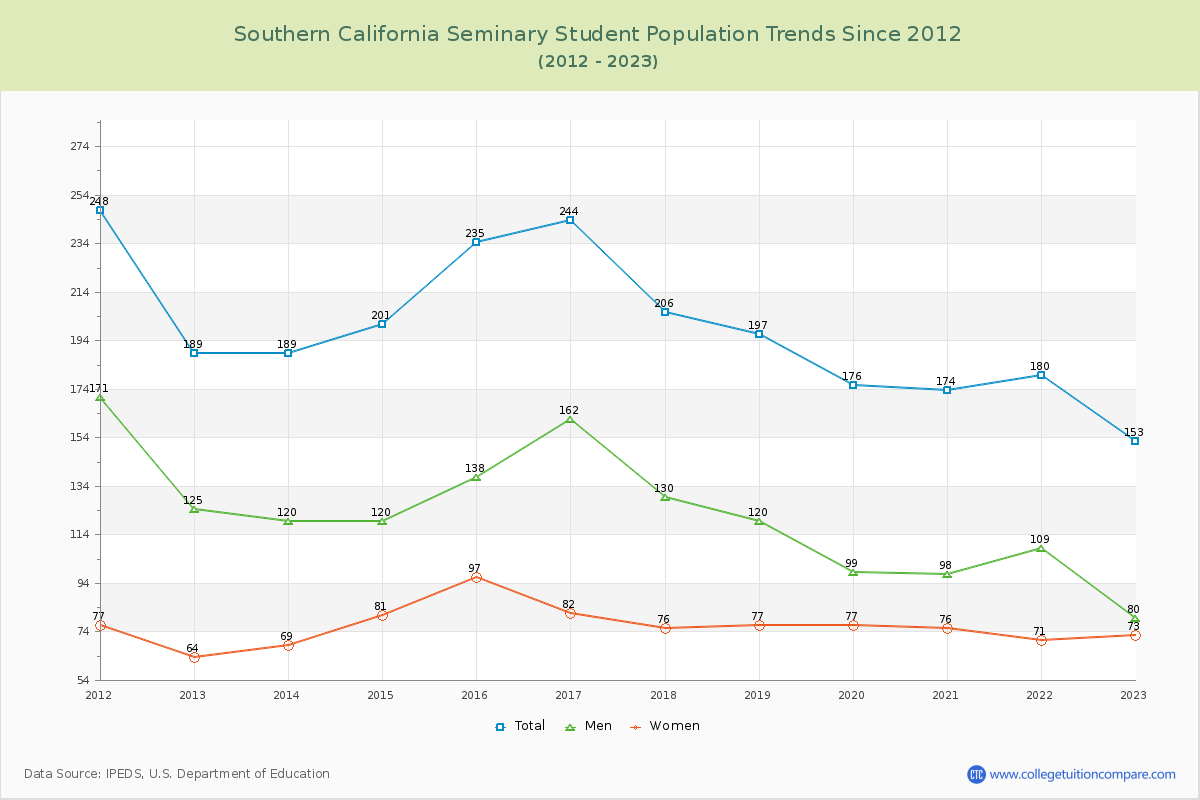
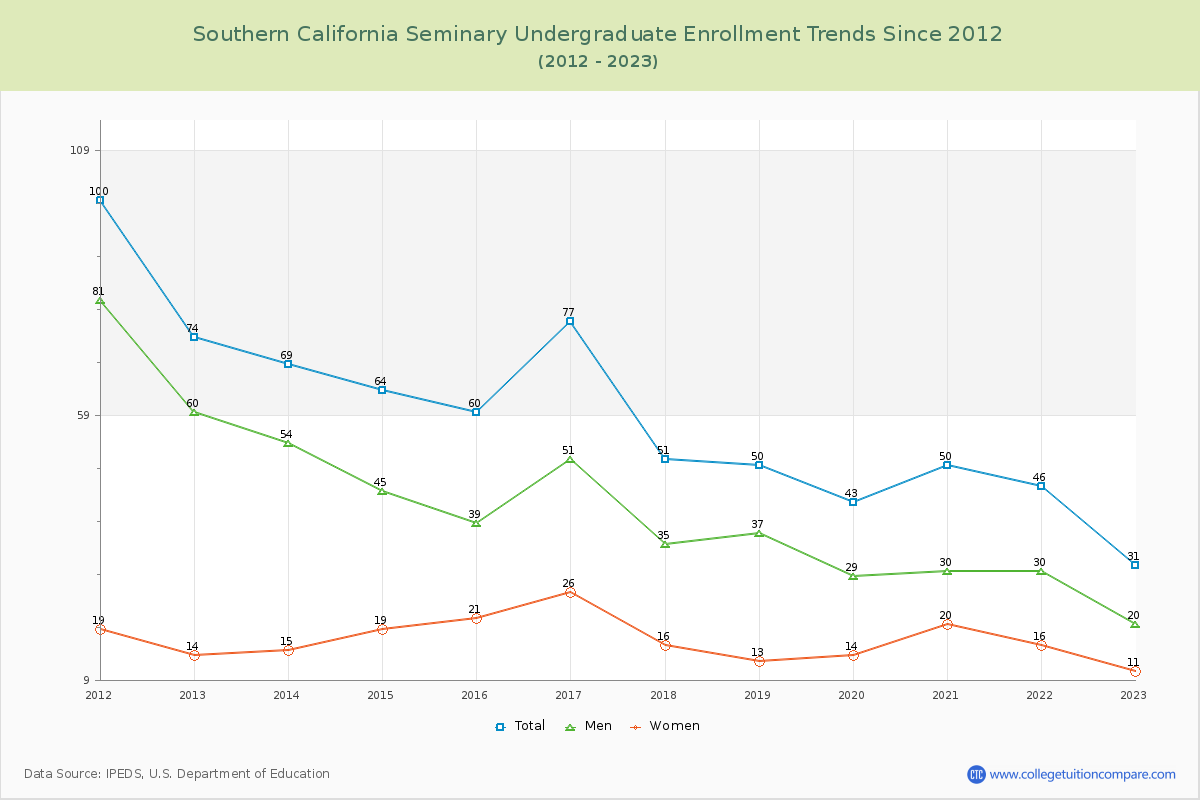
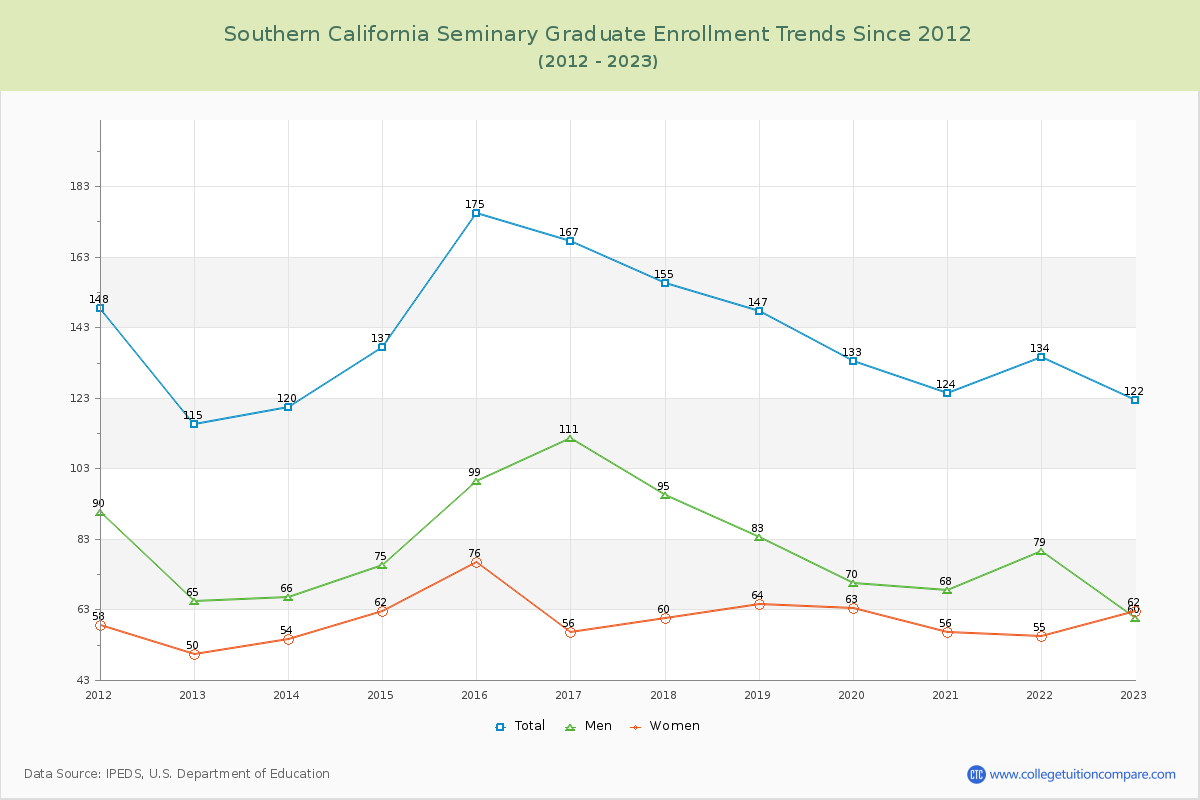
Student Population Changes
The average student population over the last 12 years is 195 where 153 students are attending the school for the academic year 2022-2023.
20.26% of total students is undergraduate students and 79.74% students is graduate students. The number of undergraduate students has decreased by 43 and the graduate enrollment has increased by 7 over past 10 years.
The female to male ratio is 0.91 to 1 and it means that there are similar numbers of female and male students enrolled in Southern California Seminary.
The following table and chart illustrate the changes in student population by gender at Southern California Seminary since 2012.
| Year | Total | Undergraduate | Graduate | ||||
|---|---|---|---|---|---|---|---|
| Total | Men | Women | Total | Men | Women | ||
| 2012-13 | 189 | 74 | 60 | 14 | 115 | 65 | 50 |
| 2013-14 | 189 0 | 69 -5 | 54 -6 | 15 1 | 120 5 | 66 1 | 54 4 |
| 2014-15 | 201 12 | 64 -5 | 45 -9 | 19 4 | 137 17 | 75 9 | 62 8 |
| 2015-16 | 235 34 | 60 -4 | 39 -6 | 21 2 | 175 38 | 99 24 | 76 14 |
| 2016-17 | 244 9 | 77 17 | 51 12 | 26 5 | 167 -8 | 111 12 | 56 -20 |
| 2017-18 | 206 -38 | 51 -26 | 35 -16 | 16 -10 | 155 -12 | 95 -16 | 60 4 |
| 2018-19 | 197 -9 | 50 -1 | 37 2 | 13 -3 | 147 -8 | 83 -12 | 64 4 |
| 2019-20 | 176 -21 | 43 -7 | 29 -8 | 14 1 | 133 -14 | 70 -13 | 63 -1 |
| 2020-21 | 174 -2 | 50 7 | 30 1 | 20 6 | 124 -9 | 68 -2 | 56 -7 |
| 2021-22 | 180 6 | 46 -4 | 30 0 | 16 -4 | 134 10 | 79 11 | 55 -1 |
| 2022-23 | 153 -27 | 31 -15 | 20 -10 | 11 -5 | 122 -12 | 60 -19 | 62 7 |
| Average | 195 | 56 | 39 | 17 | 139 | 79 | 60 |